peer reviewed scientific journals
Peer-reviewed scientific journals are academic publications that feature articles which have undergone a rigorous evaluation process by experts in the field before being published. This process typically involves Submission: Authors submit their rese
Download Presentation

Please find below an Image/Link to download the presentation.
The content on the website is provided AS IS for your information and personal use only. It may not be sold, licensed, or shared on other websites without obtaining consent from the author. If you encounter any issues during the download, it is possible that the publisher has removed the file from their server.
You are allowed to download the files provided on this website for personal or commercial use, subject to the condition that they are used lawfully. All files are the property of their respective owners.
The content on the website is provided AS IS for your information and personal use only. It may not be sold, licensed, or shared on other websites without obtaining consent from the author.
E N D
Presentation Transcript
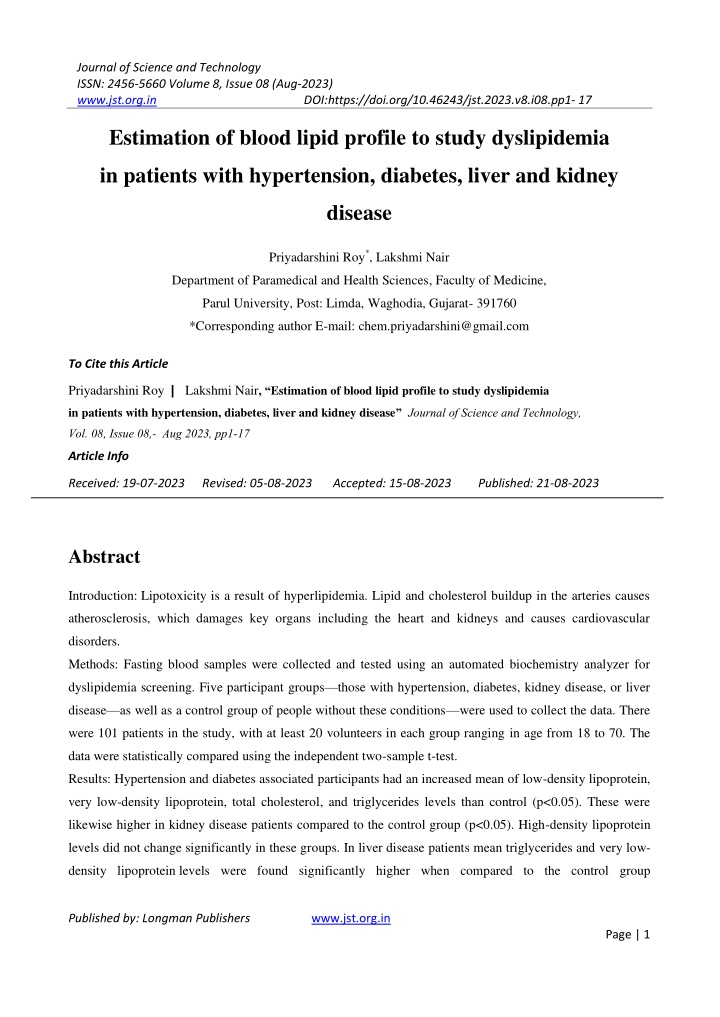
Journal of Science and Technology ISSN: 2456-5660 Volume 8, Issue 08 (Aug-2023) www.jst.org.in DOI:https://doi.org/10.46243/jst.2023.v8.i08.pp1- 17 Estimation of blood lipid profile to study dyslipidemia in patients with hypertension, diabetes, liver and kidney disease Priyadarshini Roy*, Lakshmi Nair Department of Paramedical and Health Sciences, Faculty of Medicine, Parul University, Post: Limda, Waghodia, Gujarat-391760 *Corresponding author E-mail: chem.priyadarshini@gmail.com To Cite this Article Priyadarshini Roy| Lakshmi Nair, Estimation of blood lipid profile to study dyslipidemia in patients with hypertension, diabetes, liver and kidney disease Journal of Science and Technology, Vol. 08, Issue 08,- Aug 2023, pp1-17 Article Info Received: 19-07-2023 Revised: 05-08-2023 Accepted: 15-08-2023 Published: 21-08-2023 Abstract Introduction: Lipotoxicity is a result of hyperlipidemia. Lipid and cholesterol buildup in the arteries causes atherosclerosis, which damages key organs including the heart and kidneys and causes cardiovascular disorders. Methods: Fasting blood samples were collected and tested using an automated biochemistry analyzer for dyslipidemia screening. Five participant groups those with hypertension, diabetes, kidney disease, or liver disease as well as a control group of people without these conditions were used to collect the data. There were 101 patients in the study, with at least 20 volunteers in each group ranging in age from 18 to 70. The data were statistically compared using the independent two-sample t-test. Results: Hypertension and diabetes associated participants had an increased mean of low-density lipoprotein, very low-density lipoprotein, total cholesterol, and triglycerides levels than control (p<0.05). These were likewise higher in kidney disease patients compared to the control group (p<0.05). High-density lipoprotein levels did not change significantly in these groups. In liver disease patients mean triglycerides and very low- density lipoprotein levels were found significantly higher when compared to the control group Published by: Longman Publishers www.jst.org.in Page | 1
Journal of Science and Technology ISSN: 2456-5660 Volume 8, Issue 08 (Aug-2023) www.jst.org.in DOI:https://doi.org/10.46243/jst.2023.v8.i08.pp1- 17 (p<0.05). Mean high density lipoprotein levels in individuals with liver disease reveal a significant drop when compared to the control group, with a 90% confidence level. Conclusion: A link between hyperlipidemia and patients with hypertension, diabetes, liver disease, and renal disease was observed. Diabetes and high blood pressure were present in the majority of patients with renal and hepatic dysfunction. Keywords: Hypertension; Diabetes; Liver; Kidney; Lipid. Introduction One of the essential components in the body to maintain cell function and homeostasis is lipid. All living cells are made up of lipids. However, lipotoxicity can occur when there is too much lipid in certain tissues and cells. This process can have an impact on the body through the dysfunction of many organs, including skeletal muscle, the liver, the heart, and the endocrine pancreas (1).CVD and stroke are the major healthcare challenges facing humanity. Important risk factors for stroke include diabetes, hypertension, and dyslipidemia. Triglycerides, very low-density lipoprotein (VLDL), low-density lipoprotein (LDL), and high- density lipoprotein (HDL) are the four distinct groups of lipoproteins that can be found in blood. Coronary heart disease may develop due to elevated levels of low-density lipoprotein cholesterol (LDL-C). Even if LDL cholesterol levels are within the recommended range, patients with hypertriglyceridemia may still be at increased risk for cardiovascular disease (CVD) (2). When insulin resistance occurs, many metabolic changes lead to heart disease. Due to the inhibition of lipoprotein lipase activity, an increase in the flow of free fatty acids in people with diabetes causes changes in the lipid profile such as high LDL, VLDL and TG values, and raises the risk of CVD in people with diabetes (3). The liver has a crucial role in digestion as well as in the transportation of lipids; hence, liver dysfunction makes the lipid profile abnormal. The liver promotes the production of apolipoproteins. They trigger the enzymes accountable for the digestion of lipoproteins and bind to particular receptors, thereby controlling the digestion of lipids. Increased of fats in liver is often associated with increased secretion of hepatic triglycerides (4). Cirrhosis, liver failure, and portal hypertension are the major outcomes of the advancement of liver fibrosis. Obesity and alcohol consumption increase the risk of non-alcoholic (NALFD) and alcoholic fatty liver disease, respectively. Non- alcoholic fatty liver disease (NAFLD) is now recognized as the most prevalent liver disease, and frequently associated with metabolic diseases such as type 2 diabetes (T2DM), hypertension, obesity, dyslipidaemia and CVD. NAFLD can increase the risk of CVD or stroke (5) If the issue is identified and treated at an early stage, it is often feasible to stop it from getting worse. All NAFLD subtypes have been related to an increased CVD risk, but those with fibrosis and NASH are at an even higher risk. During the evolution of NAFLD, inflammation of visceral adipose tissue may activate pro-inflammatory pathways (JNK and NF- B) and downstream synthesis of pro-coagulant factors. Dyslipidemia, resistance to insulin, altered coagulation states and augmented inflammation results in an increased CVD risk in NAFLD (6). On the other hand, due Published by: Longman Publishers www.jst.org.in Page | 2
Journal of Science and Technology ISSN: 2456-5660 Volume 8, Issue 08 (Aug-2023) www.jst.org.in DOI:https://doi.org/10.46243/jst.2023.v8.i08.pp1- 17 to abnormalities in the digestion of lipids in chronic kidney disease, it shows atherogenic properties. One of the main risks associated with CKD is cardiovascular disease (CVD). For individuals with end-stage renal disease, atherosclerotic heart disorders are the major cause of morbidity and death. The alteration in lipoprotein metabolism that results in dysilipidemia is caused by low hepatic triglyceride lipase, decreased lipoprotein lipase, increased cholesterol ester transfer protein, decreased receptor number for these proteins, as well as altered lipoprotein substrates for the receptors in patients with CKD (7). Dyslipidemia, especially hyperlipidemia, has been observed in nephrotic syndrome and other kidney diseases. This dyslipidemia is a risk factor for the development of CVD and the advancement of renal disorders, which may gradually produce tubulointerstitial damage, glomerulosclerosis, or atherosclerosis. Dyslipidemia, if not effectively managed, will play a significant role in a dismal prognosis (8). Therefore, lipid abnormalities are important markers of CKD, as their abnormality leads to cardiovascular mortality in patients with chronic renal failure (CRF). Patients with poor renal function had at least a twofold increase in CVD risk (9). Proteinuria, an indicator of kidney impairment, is linked to an increased risk of CVD (10). Materials and Methodology: This study was conducted at Parul Sevashram Hospital, Vadodara, Gujarat after obtaining approval from the Institutional Ethics Committee with approval number: PU/IECHR/PIMSR/00/081734/5308. Five subgroups totalling a minimum of 20 people each were included in the study, bringing the total number of participants to 101. Patients with diabetes, liver and kidney disease, as well as those with high blood pressure, made up the subgroups. In another sub group, 20 participants were taken as controls. The medical records and histories of the patients were studied. Samples and data were collected after satisfactory evaluation of medical records. Regardless of gender, only patients who were at least 18 but not more than 70 years old were chosen. Control group was free from liver, kidney, or any other chronic diseases like diabetes and hypertension. Pregnant and breast-feeding woman and patients above 70 years were not included in the study. Patients who were in dialysis were also not included in the study. Patient with viral hepatitis were also not included in the study. Patients who have history of taking lipid lowering drugs were not included in the study. Using Minitab software, an independent two-sample t-test was conducted to compare the control group of 20 participants with the 20 participants with diabetes mellitus and the 20 participants with liver disease. A fasting venous blood sample of 5 ml was collected by a 22-gauge, 1 inch sterile vacuated blood collecting needle and kept in a plain tube (red top-tube). The collected blood was then centrifuged at 3500 rpm for 10 minutes. When necessary, storage was done by centrifuging the blood sample for avoiding any blood lysis and thus separated serum was kept in the micro-tube and stored in the refrigerator at +2 C to +4 C up to maximum of 48 hours. Then all the parameters of the lipid profile such as LDL, HDL, VLDL, TC, TG, were tested in the automated biochemistry analyser. Published by: Longman Publishers www.jst.org.in Page | 3
Journal of Science and Technology ISSN: 2456-5660 Volume 8, Issue 08 (Aug-2023) www.jst.org.in DOI:https://doi.org/10.46243/jst.2023.v8.i08.pp1- 17 Results:In the present study, higher mean of TC, TG, VLDL, and LDL was found in the hypertension group with respect to the normal group. The mean of TC, triglyceride, VLDL, and LDL was found to be 184.4, 150.4, 30.1, and 111.6 mg/dl, respectively, in hypertensive patients compared to the mean of 143.3, 81.9, 16.37, and 79.7 mg/dl in controls, respectively. Serum HDL content was found to be lower than 30 mg/dL in some of the patients, with no significant change in overall mean HDL content in the hypertensive group (mean 44.4 mg/dl) vs. 47.2 mg/dL in the normal group. P-value= 0.014, 0.000, 0.002, 0.008 and 0.000 were obtained for LDL, VLDL, non- HDL, TC, and TG, respectively when compared between the control and the hypertensive group. Around 25% of participants with hypertension have LDL levels greater than 130 mg/dl. 40 50% of patients have TG and TC levels greater than 135 and 200 mg/dl, respectively, indicating an increased level of bad lipid content during hypertension or cardio vascular diseases. Hypertension associated participants revealed no significant reduction in HDL levels. In kidney disease, SGPT and SGOT were found satisfactory; however, creatinine, urea, uric acid and protein were found on the higher side. The mean of TC, triglyceride, VLDL, and LDL is 172.6, 138.8, 26.8, and 103.6 mg/dl, respectively, in kidney disorder patients. The mean of TC, triglyceride, VLDL, and LDL in the normal group is found to be 143.3, 81.9, 16.37, and 79.7 mg/dl, respectively. The mean HDL is found to be 46.4 mg/dl in kidney patients compared to 47.2 mg/dl in the normal group, which shows no substantial change in HDL level in kidney disorder participants compared to the control and hypertensive groups. The increase in mean TC level is found to be statistically significant, and mean triglycerides level increases significantly in patients with kidney diseases than the normal group. Mean of LDL and VLDL was also high in these patients, with no significant change in HDL levels. P-value=0.003, 0.010 0.000, 0.004, 0.007 were obtained for LDL, VLDL, non-HDL, TC and TG respectively when compared between the control group and the kidney disease group. 30 35% of patients have higher TG and TC than 135 and 200 mg/dl, respectively. 15% of kidney disease participants were in the advanced phase of CKD with an eGFR of 30 mL/min/1.73 m2 and had lower TC, LDL, and HDL but a high TG to HDL ratio. Thus, hypertension was also found in most of kidney-disease participants during the study thus, dyslipidaemia with significantly increased levels of non HDL, TC and TG can be attributed to an increased risk for atherosclerotic CVD . In the present study, the mean values of TC, TG, VLDL, and LDL are significantly higher in diabetic patients. In DM patients, the mean for TC, triglyceride, VLDL, and LDL is found to be 183.5, 142.3, 28.5, and 103.4, respectively, while the mean for the normal group is 143.3, 81.9, 16.37, and 79.7 mg/dl, respectively. In 30 35% of diabetic patients, high TG and TC values of greater than 135 mg/dl and 200 mg/dl were also found. Low HDL was found in some of the individuals, but no significant difference in HDL content (mean 51.2 mg/dl in DM vs. 47.2 mg/dl in normal) was observed in the overall group with a 90 95% confidence level. There was no significant reduction in HDL observed except that 20% of participants showed low HDL cholesterol. Bad lipid content, i.e., triglycerides, TC, LDL, etc., is increased in almost 50 Published by: Longman Publishers www.jst.org.in Page | 4
Journal of Science and Technology ISSN: 2456-5660 Volume 8, Issue 08 (Aug-2023) www.jst.org.in DOI:https://doi.org/10.46243/jst.2023.v8.i08.pp1- 17 55% of patients. VLDL and triglyceride mean values increased significantly when compared to the control group. Based on this observation, it can be said that metabolic disorders like diabetes may have an effect on lipid profiles. P-value= 0.006 for LDL, P-value=0.004 for VLDL, P-value= 0.435 for HDL, P-value= 0.001 for non-HDL, P-value=0.001 for TC, P-value=0.004 for TG, were obtained when compared between the control group and the diabetes group. It has been observed that diabetes was present in 90% of liver patients. During the liver function test, SGPT, SGOT, and ALP were also found to be on the higher side. Additionally, it is noticed that the liver diseases were associated with slightly higher levels of total bilirubin. ALP and SGPT levels are markedly elevated in alcoholic fatty liver disease and chronic active hepatitis. Patients with liver disorders had mean TC, triglyceride, VLDL, and LDL levels of 155.9, 148.6, 29.7, and 87.6 mg/dl, respectively, compared to 143.3, 81.9, 16.37, and 79.7 mg/dl for the normal group. With a 90% confidence level, the mean HDL found in liver disease participants was 38 mg/dl, compared to 47.2 mg/dl in the normal group, showing a significant drop in HDL level compared to the control. In liver disease participants, mean TG and VLDL-C levels are significantly elevated with slightly reduced HDL-C level, whereas change in mean TC and LDL-C levels are found non-significant than normal participants. Individuals with alcoholic hepatitis and cirrhosis have a significantly higher SGOT/SGPT ratio. 15% participants have liver cirrhosis with a higher SGOT value than SGPT value, and they have lower serum HDL, TG, TC, LDL, VLDL than the normal group. This is due to the decrease in the general bile-acid pool size in liver cirrhosis patients because of the decline in bile-acid synthesis in the liver. Cirrhosis affects the solubility of unconjugated bilirubin in bile and reduce it due to interaction with bile salts. 35-40% patients have higher TG and TC than 135 and 200 mg/dl respectively. P-value= 0.462, 0.008, 0.097 ,0.197, 0.366 and 0.008 for LDL, for VLDL, HDL, non-HDL, and for TG, were obtained when compared between the control group and the liver disease group respectively. The graphical illustrations provide more information about the dyslipidemia of the specific patient as well as the average results for the various disease categories, when compared to the control group. Table 1: Statistical analysis of Lipid Parameters Mean Mean Std. Std. dev Mean Std. dev. Mean Std. dev Mean Std. dev dev Lipid (Control) (Diabetes) (Liver disease) (Kidney disease) (HTN) Mean of lipid parameters in mg/dL LDL 79.7 20.9 111.6 50.1 104.0 32.4 91.2 47.5 103.6 26.9 VLDL 16.4 4.8 30.1 13.4 26.5 14.6 35.5 29.2 26.8 16.4 Published by: Longman Publishers www.jst.org.in Page | 5
Journal of Science and Technology ISSN: 2456-5660 Volume 8, Issue 08 (Aug-2023) www.jst.org.in DOI:https://doi.org/10.46243/jst.2023.v8.i08.pp1- 17 HDL 47.2 10.6 44.4 15.2 51.7 19.4 37.0 22.3 46.4 14.7 Non- HDL 96.1 21.3 140.0 54.0 130.9 39.7 125.4 57.2 131.0 32.2 TC 143.3 22.4 184.4 59.4 182.5 43.0 162.4 65.7 177.4 36.3 TG 81.9 23.9 150.4 67.2 137.4 73.5 163.8 107.9 134.1 82.2 Published by: Longman Publishers www.jst.org.in Page | 6
Journal of Science and Technology ISSN: 2456-5660 Volume 8, Issue 08 (Aug-2023) www.jst.org.in DOI:https://doi.org/10.46243/jst.2023.v8.i08.pp1- 17 Table 2: P value during Statistical analysis of Lipid Parameters (Control vs Subgroups) Lipid Parameters Hypertension Diabetes Liver disease Kidney disease LDL 0.014 0.006 0.462 0.003 VLDL 0.00 0.004 0.008 0.010 HDL 0.503 0.435 0.097 0.844 Non- HDL 0.002 0.001 0.197 0.000 TC 0.008 0.001 0.366 0.004 TG 0.00 0.004 0.008 0.007 CNT-Control, HTN-Hypertension, DB- Diabetes, LVD-Liver disease, KDN-kidney disease Mean is Figure 1: Graphical representation of LDL value in different groups symbolized by Published by: Longman Publishers www.jst.org.in Page | 7
Journal of Science and Technology ISSN: 2456-5660 Volume 8, Issue 08 (Aug-2023) www.jst.org.in DOI:https://doi.org/10.46243/jst.2023.v8.i08.pp1- 17 CNT-Control, HTN-Hypertension, DB- Diabetes, LVD-Liver disease, KDN-kidney disease Mean is Figure 2: Graphical representation of VLDL value in different groups symbolized by CNT-Control, HTN-Hypertension, DB- Diabetes, LVD-Liver disease, KDN-kidney disease Mean is symbolized by Figure 3: Graphical representation of HDL value in different groups Published by: Longman Publishers www.jst.org.in Page | 8
Journal of Science and Technology ISSN: 2456-5660 Volume 8, Issue 08 (Aug-2023) www.jst.org.in DOI:https://doi.org/10.46243/jst.2023.v8.i08.pp1- 17 CNT-Control, HTN-Hypertension, DB- Diabetes, LVD-Liver disease, KDN-kidney disease Mean is symbolized by Figure 4: Graphical representation of Total cholesterol TC value in different groups CNT-Control, HTN-Hypertension, DB- Diabetes, LVD-Liver disease, KDN-kidney disease Mean is symbolized Figure 5: Graphical representation of Triglycerides TG value in different groups by Published by: Longman Publishers www.jst.org.in Page | 9
Journal of Science and Technology ISSN: 2456-5660 Volume 8, Issue 08 (Aug-2023) www.jst.org.in DOI:https://doi.org/10.46243/jst.2023.v8.i08.pp1- 17 CNT-Control, HTN-Hypertension, DB- Diabetes, LVD-Liver disease, KDN-kidney disease Mean is symbolized Figure 6: Graphical representation of non-HDL value in different groups by Discussion: In the present study, mean triglyceride levels are on the higher side for the participants associated with hypertension. They revealed no significant change in HDL levels but elevated level of TC, VLDL, LDL and non-HDL levels are observed, indicating a significant rise of cardiovascular disease risk. Thus, dyslipidaemia was reported by different authors in various studies. In a study, compared with normal people, hypertensive patients were found to have higher LDL, TC, and triglycerides and lesser HDL content, which was significant. The mean of TC, LDL, and non-HDL was higher among the hypertensives. The mean HDL was comparable with that of control (11). In another study, total and non-HDL (Total minus HDL) levels were increased irrespective of sex. Blood pressure and triglyceride levels rose along; however, this correlation was not strong in lean patients. In population, subgroups with heavy alcohol intake, HDL cholesterol level had a positive correlation with blood pressure (12). In an alternative study, when compared the patients with TC levels of 167 mg/dL to those with TC levels of 222 mg/dL, the risk of developing hypertension was considerably found higher in the latter group. A high risk of hypertension was shown to be associated with elevated blood levels of TC, LDL, and non-HDL (13). In a study conducted in Bangladesh, it was found that the triglycerides and serum HDL were significantly higher in study group of hypertensions with respect to the control. The mean serum HDL was lower and the mean triglycerides were higher compared to the normal group (14). It was reported that the local renin-angiotensin system affects lipid Published by: Longman Publishers www.jst.org.in Page | 10
Journal of Science and Technology ISSN: 2456-5660 Volume 8, Issue 08 (Aug-2023) www.jst.org.in DOI:https://doi.org/10.46243/jst.2023.v8.i08.pp1- 17 metabolism. Angiotensin II produced by adipocytes, appears to inhibit the differentiation of human adipocyte precursors, thereby reduce the insulin-sensitive adipocytes. Conversely, the lipid string capacity of adipose tissue is decreased. This leads to the deposition of TG in the liver and skeletal muscles, causing insulin resistance, which further affects lipid metabolism. The role of renin-angiotensin process on hypertension and insulin resistant was studied extensively (15). In the current study, an increased in the mean of triglyceride, VLDL, LDL, non-HDL and TC is observed compared to the control for the patients with kidney disorders, while no significant change in the mean HDL level is observed. Numerous studies were carried out to evaluate the role of the lipid profile in the onset and progression of CKD. In one of the studies, an independent correlation of high LDL content and reduced kidney activities in 2702 dyslipidemia individuals was specified (16). In addition, patients with an increased LDL/HDL ratio (>4.4) had worst renal activities. More than 2,000 participants were investigated, and identified that high TG and low HDL were the risk aspects for kidney failure (17).The advancement of renal disease was also found to be significantly linked with high levels of triglycerides, TC, LDL, and reduced HDL (18). In a study it was observed that among the lipid profiles, high density lipoprotein was the only lipid factor related to renal dysfunction (19). Serum triglyceride and VLDL levels were high and HDL levels were decreased in a study conducted on 100 patients (50 CKD and 50 controls). The TG/HDL and LDL/HDL ratios of the CKD patients were higher than the control (p<0.05). With the decrease of renal function, serum TG and VLDL level were increased and HDL levels were reduced (p<0.05). A person suffered from CKD has lipid abnormalities such as hypertriglyceridemia, increased VLDL, and decreased HDL that result in atherosclerosis and cardiovascular disease (CVD) (20). In CKD, a decrease in triglyceride lipase in the liver and a decline in lipoprotein-lipase and lecithin-cholesterol-acyl-transferase occur. There is also a rise in cholesterol-ester-transfer-protein. A modification in lipoprotein substrates for receptors has been observed, which causes poor lipoprotein metabolism. The renal proximal tubule contains megalin and cubilin receptors. Lipid-binding and regulatory proteins such as leptin, apolipoprotein A-I, and albumin act as ligands, and their receptors can transport lipids directly to the nephron of the kidney and indirectly influence the digestion of blood and tissue lipids. More lipid-binding proteins and hormones that regulate lipids more effectively through receptors are absorbed by the kidney. In uremia-induced atherosclerosis, dyslipidemia may result from decreased kidney function and receptor-mediated uptake of lipid-binding and lipid-regulating proteins (21). In the current study, most of the members with kidney disease were suffered from hypertension and diabetes. Patients with mild hypertension experience increasing renal damage, leading to greater nephron loss and increased glomerular pressure transmission. Therefore, although challenging, maintaining normotension in CKD patients continues to be the major treatment strategy. High blood pressure constricts the blood vessels in the kidney, reducing blood flow and impairing kidney function. At this point, the kidneys cannot eliminate all the waste and excess fluid from the body. Too much fluid in the bloodstream Published by: Longman Publishers www.jst.org.in Page | 11
Journal of Science and Technology ISSN: 2456-5660 Volume 8, Issue 08 (Aug-2023) www.jst.org.in DOI:https://doi.org/10.46243/jst.2023.v8.i08.pp1- 17 can further cause high blood pressure, and is the basis for further kidney damage (22). Although diuretics and renin-angiotensin-system (RAS) blockers have opposite side effects on the balance of potassium and magnesium, yet work together to lower blood pressure; hence, their combination may be a sensible antihypertensive regimen for these patients (23). It is widely recognized that an excessive buildup of lipids in the renal parenchyma contributes to the growth of CKD and can worsen the condition at the tubular and glomerular levels. Such findings suggests that CKD therapy should take into account a lipid-lowering pharmaceutical approach in conjunction with a significant lifestyle adjustment (24). In the present study, we have observed dyslipidemia in all subgroups of diabetic, and liver disease patients. The same has been reported by different authors. In one of the studies, T2DM was related to higher level of TC and TG but low HDL. High triglycerides with less HDL content were correlated with pre-diabetes. From this study, it was found that increased in TG, non-HDL, and TG/HDL ratio will further increase the risk of T2DM. High triglycerides were found in 26 to 64 % participants, depending on their sugar tolerance. About 90% or more participants showed low HDL levels. A significant linear correlation was found among high cholesterol, high triglycerides, low HDL and increased sugar intolerance (25). In another study, analysis of HDL, LDL, and TC did not reveal significant associations. An increased risk of diabetes particularly in female, was linked to the increasing level of TG, VLDL, non-HDL, and the TG /HDL ratio (26). Fasting blood glucose (FBG), TC, HDL, LDL, TG, and glycosylated hemoglobin (HBA1C) levels were evaluated and found that diabetes is associated with many of the consequences of dyslipidemia. High LDL, TC, triglycerides and low HDL levels were observed in individuals with poor glycemic control (27). A small amount of stable hemoglobin complex known as Hemoglobin-A1C are formed slowly and non- enzymatically from hemoglobin and glucose and they are clinically useful tool to know glycemic control over the past three months (28). In the present study, the HbA1C was found to be in the range of 5.9 to 14.8. As stated by the American Diabetes Association, HbA1C values in between 5.7% and 6.5%, are considered as pre-diabetic and equal to or more than 6.5% are considered as diabetic. Substantial increases are observed for TC, triglycerides, VLDL, LDL and non-HDL (p < 0.05), based on statistical evaluation. Elevated triglyceride and TC levels, with values greater than 135mg/dL and 200 mg/dl, are revealed in some participants with diabetes who are at risk for cardiovascular diseases. The mean HDL content does not alter meaningfully. High LDL levels can build up plaque in the arteries, leading to a heart attack or stroke. The main therapeutic goals of cholesterol-lowering drugs are to lower LDL. A higher amount of TG in the blood is found during heart disease and pancreatitis. The risk of heart attack and stroke increases when there is a higher number of triglycerides and a lower amount of HDL, or a higher amount of serum triglycerides and a higher amount of serum LDL (29). The interactive effects of increased TG and LDL/HDL ratio may indicate that dyslipidemia might exaggerate the risk of diabetes in hypertensive patients (30). Various factors can cause diabetic dyslipidemia because of the effects of insulin on the production of hepatic apolipoprotein, the Published by: Longman Publishers www.jst.org.in Page | 12
Journal of Science and Technology ISSN: 2456-5660 Volume 8, Issue 08 (Aug-2023) www.jst.org.in DOI:https://doi.org/10.46243/jst.2023.v8.i08.pp1- 17 control of lipoprotein lipase, the activity of cholesterol ester- transferring protein (CETP), and the peripheral effects of fat and muscle insulin. Lipids control apo B production, augmented lipolysis in adipocytes due to less insulin secretion, causes more release of fatty acids from fat cells. Surge in fatty acid movement to the liver in diabetes, may cause an abnormal increase of VLDL. Insulin may also directly affect the liver for degradation of apo B apoproteins. A decrease in insulin, results in more production of apo B and other apoproteins that may increase VLDL level. Hepatic lipase hydrolyses phospholipids and triglycerides in HDL and remnant lipoproteins. Some of the studies showed that, lipoprotein lipase activity is mediated by insulin, and its activities are reduced in diabetes. Insulin deficiency leads to a reduction of hepatic lipase enzymes as well as receptors, which causes abnormalities in lipid profile (31). The present study in liver patients shows that mean triglyceride and VLDL were increased significantly with 95% confidence level. The mean LDL and the mean TC were also increased slightly but did not change significantly. A significant decrease in HDL was observed than control with 90 % confidence level in liver patients. Most of the participants with NALFD have higher TC and TG. A few patients with liver cirrhosis, in the present study have lower LDL and TG lipid profile. Blood lipid levels were lower in cirrhotic patients than in the healthy group (32). Many changes in metabolism occur in chronic liver disease causing dyslipidaemia. The liver promotes the production of apolipoproteins. They trigger the enzymes accountable for the digestion of lipoproteins and bind to particular receptors, thereby controlling the digestion of lipids. Due to reduced lipoprotein synthesis and increased catabolism can lead to a decrease in plasma lipids in liver cirrhosis. The buildup of lipid droplets into the hepatocytes occurs due to numerous dysfunctions including change in -oxidation, the secretion of VLDL, and routes of synthesis of fatty acids and thus causes hepatic steatosis. Likewise, Statistical analysis showed that, the increase in TC (p-value: 0.001), LDL (p-value: 0.000), and VLDL (p-value: 0.0) were related with progression of NAFLD (33). NAFLD is recognized by abnormal observation of liver function test parameters. Aspartate aminotransferase (AST), Alanine transaminase (ALT), Alkaline phosphatase (ALP) were observed high in the NALFD group. In comparison to non-NALFD group, the mean TG, and TC values were found to be higher, but HDL was less in the NAFLD group. Abnormal lipid profile was observed in the NAFLD cluster including higher TC, LDL/HDL ratio and TC/HDL ratio as well as lower HDL concentration. In addition, while there was a positive relationship with TG and NAFLD, but no relationship was obtained between LDL and NAFLD (34). In a study, levels of TC, LDL, TG were found to be more and HDL was found to be lesser than controls. Dyslipidaemia was more significant in the NAFLD group (35). Mean LDL and mean TC were increased than normal in NAFLD individuals in a different study (36). Also in another study, comparison of chemical parameters of NAFLD, showed a positive association between high TG, LDL, TC levels. Change in HDL level was non-significant in the group when compared to control (37). Published by: Longman Publishers www.jst.org.in Page | 13
Journal of Science and Technology ISSN: 2456-5660 Volume 8, Issue 08 (Aug-2023) www.jst.org.in DOI:https://doi.org/10.46243/jst.2023.v8.i08.pp1- 17 Conclusion: Vital risk factors of CVD include hypertension and dyslipidemia. In routine clinical practice, it is common to see the coexistence of hypertension and hyperlipidemia, which can greatly raise the risk of target organ damage. People who are pre-diabetic and who have diabetes are much more likely to have dyslipidemia. The present study assessed that dyslipidemia with increased level of LDL, non-HDL, TC and triglyceride levels may need to consider as a risk associated with diabetes. Hyperlipidemia in renal disease patients may provide a major risk to the patients as well as an increased risk of CVD. Any dysfunction in liver causes abnormality in metabolism of glucose and lipids. Imbalance in liver function may proportionally affect the lipid parameters. In patients with various types of liver disease, such as NAFLD, the levels of LDL, TC, and triglycerides rise while HDL falls, raising the risk of liver dysfunction or failure as well as CVD. Considering the increased risk to patients, the current study suggests that lipid profile monitoring is essential for humans to prevent disorders including diabetes, liver failure, cardiovascular disease, and stroke. It was suggested from a therapeutic standpoint that patients with dyslipidemia need stringent BP and diet management. In order to avoid serious detrimental events in patients with multiple CVD risk factors, it is crucial to control the overall risk efficiently. As a result, medical professionals should pay close attention to how blood pressure changes over time and educate the community about the management of liver disease towards cardiovascular risk evaluation with continuous checking for undiagnosed diabetes and renal comorbidities, as well as offer professional assistance to patients with dyslipidemia to prevent or postpone the onset of hypertension and diabetes. Medical professional need to evaluate the need of statin and other lipid lowering drugs likeproprotein convertase subtilsin-kexin (PCS) K9 inhibitors, fibrates, niacin, or novel medicines such bempedoic acid and inclisiran in individuals, for lowering lipids in CKD and hypertensive patients, thus may be useful in reducing the risk of CVD. The association between the lipid profile and other markers of liver function test and renal function test may be better understood by conducting a detailed and extensive study over an extended period of time with a large number of patients who fall into a certain group, such as those with fatty liver, liver cirrhosis, etc. Acknowledgements: For the help and direction in conducting the study, I am grateful to the faculty and staff of Parul Institute of Paramedical and Health Sciences (PIPHS) at Parul University and Head of the Institute (HOD), Dr Hemant Kumar Patadiya. I would also like to express my gratitude to the Parul Sevashram Hospital employees and Parul University Management for their assistance. References: 1. Bobulescu IA. Renal lipid metabolism and lipotoxicity. Curr Opin Nephrol Hypertens. 2010 Jul;19(4):393- 402. doi: 10.1097/MNH.0b013e32833aa4ac, PMID 20489613. Published by: Longman Publishers www.jst.org.in Page | 14
Journal of Science and Technology ISSN: 2456-5660 Volume 8, Issue 08 (Aug-2023) www.jst.org.in DOI:https://doi.org/10.46243/jst.2023.v8.i08.pp1- 17 Talayero BG, Sacks FM. The role of triglycerides in atherosclerosis. Curr Cardiol Rep. 2011 Dec;13(6):544- 2. 52. doi: 10.1007/s11886-011-0220-3, PMID 21968696. 3. Ormazabal V, Nair S, Elfeky O, Aguayo C, Salomon C, Zu iga FA. Association between insulin resistance and the development of cardiovascular disease. Cardiovasc Diabetol. 2018;17(1):122. doi: 10.1186/s12933- 018-0762-4, PMID 30170598. 4. Jiang ZG, Robson SC, Yao Z. Lipoprotein metabolism in non-alcoholic fatty liver disease. J Biomed Res. 2013 Jan;27(1):1-13. doi: 10.7555/JBR.27.20120077, PMID 23554788. 5. Pouwels S, Sakran N, Graham Y, Leal A, Pintar T, Yang W et al. Non-alcoholic fatty liver disease (NAFLD): a review of pathophysiology, clinical management and effects of weight loss. BMC Endocr Disord. 2022;22(1):63. doi: 10.1186/s12902-022-00980-1, PMID 35287643. 6. Przybyszewski EM, Targher G, Roden M, Corey KE. Nonalcoholic fatty liver disease and cardiovascular disease. Clin Liver Dis. 2021;17(1):19-22. doi: 10.1002/cld.1017, PMID 33552481. 7. Choudhury D, Tuncel M, Levi M. Disorders of lipid metabolism and chronic kidney disease in the elderly. Semin Nephrol. 2009 Nov;29(6):610-20. doi: 10.1016/j.semnephrol.2009.07.006, PMID 20006793. 8. Tao M, Wang HP, Sun J, Tian J. Progress of research on dyslipidemia accompanied by nephrotic syndrome. Chronic Dis Transl Med. 2020 Sep;6(3):182-7. doi: 10.1016/j.cdtm.2020.03.002, PMID 32885154. 9. Gansevoort RT, Correa-Rotter R, Hemmelgarn BR, Jafar TH, Heerspink HJ, Mann JF, et al. chronic kidney disease and cardiovascular risk: epidemiology, mechanisms, and prevention. Lancet. 2013;382(9889):339- 52. doi: 10.1016/S0140-6736(13)60595-4, PMID 23727170. 10. Cervoni JP, Th venot T, Weil D, Muel E, Barbot O, Sheppard F, et al. C-reactive protein predicts short-term mortality in patients with cirrhosis. J Hepatol. 2012;56(6):1299-304. doi: 10.1016/j.jhep.2011.12.030, PMID 22314431. 11. Chen S, Cheng W. Relationship between lipid profiles and hypertension: A cross-sectional study of 62,957 Chinese adult males. Front Public Health. 2022; 10:895499. doi: 10.3389/fpubh.2022.895499, PMID 35664125. 12. B naa KH, Thelle DS. Association between blood pressure and serum lipids in a population. The Troms study. Circulation. 1991;83(4, Apr):1305-14. doi: 10.1161/01.CIR.83.4.1305, PMID 2013148. 13. Otsuka T, Takada H, Nishiyama Y, Kodani E, Saiki Y, Kato K et al. Dyslipidemia and the risk of developing hypertension in a working age male population. J Am Heart Assoc. 2016 Mar;5(3):e003053. doi: 10.1161/JAHA.115.003053, PMID 27016576. 14. Saki SA, Nessa A, Salma MU, Begum A. Relationship of HDL-C and triglyceride with hypertension in adult men. Mymensingh Med J. Apr 01 2019;28(2):298-301. PMID 31086141. 15. Underwood PC, Adler GK. The renin angiotensin aldosterone system and insulin resistance in humans. Curr Hypertens Rep. 2013 Feb;15(1):59-70. doi: 10.1007/s11906-012-0323-2, PMID 23242734. Published by: Longman Publishers www.jst.org.in Page | 15
Journal of Science and Technology ISSN: 2456-5660 Volume 8, Issue 08 (Aug-2023) www.jst.org.in DOI:https://doi.org/10.46243/jst.2023.v8.i08.pp1- 17 16. M ntt ri M, Tiula E, Alikoski T, Manninen V. Effects of hypertension and dyslipidemia on the decline in renal function. Hypertension. 1995;26(4):670-5. doi: 10.1161/01.hyp.26.4.670, PMID 7558229. 17. Muntner P, Coresh J, Smith JC, Eckfeldt J, Klag MJ. Plasma lipids and risk of developing renal dysfunction: the atherosclerosis risk in communities study. Kidney Int. 2000;58(1):293-301. doi: 10.1046/j.1523- 1755.2000.00165.x, PMID 10886574. 18. Visconti L, Benvenga S, Lacquaniti A, Cernaro V, Bruzzese A, Conti G et al. Lipid disorders in patients with renal failure: role in cardiovascular events and progression of chronic kidney disease. J Clin Transl Endocrinol. 2016 Dec; 6:8-14. doi: 10.1016/j.jcte.2016.08.002, PMID 29067238. 19. Zhang H, Shi S, Zhao XJ, Wang JK, Liu ZW, Liu FQ et al. Association between the lipid profile and renal dysfunction in the heart failure patients. Kidney Blood Press Res. 2019;44(1):52-61). doi: 10.1159/000498834, PMID 30808836. 20. Lapinleimu H, Viikari J, Jokinen E, Routi T, Salo P, Hollo O et al. Cholesterol measurement by reflotron dry chemistry in infants, children and adults. Scand J Clin Lab Invest. 1994 Feb;54(1):61-5. doi: 10.3109/00365519409086511, PMID 8171273. 21. Moestrup SK, Nielsen LB. Nielsen et al. The role of the kidney in lipid metabolism. Curr Opin Lipidol. Jun 2005;16(3):301-6. doi: 10.1097/01.mol.0000169350.45944.d4, PMID 15891391. 22. National kidney foundation. Available from: https://www.kidney.org/news/newsroom/factsheets/High- Blood-Pressure-and-CKD. 23. Bidani AK, Griffin KA. Pathophysiology of hypertensive renal damage: implications for therapy. Hypertension. 2004;44(5):595-601. doi: 10.1161/01.HYP.0000145180.38707.84, PMID 15452024. 24. Wang T, Visentin M, Gerd A, Xianjun F, Wang Z, Zhibo G et al. Lipid accumulation and chronic kidney disease. Nutrients. 2019;11(4),722:11040722. doi: 10.3390/nu. 25. Bhowmik B, Siddiquee T, Omsland KT. Serum lipid profile and its association with diabetes and prediabetes in a rural Bangladeshi population (Int J Environ Res Public Health .2018. Sep 1944;15(9). 26. Sadeghi E, Hosseini SM, Vossoughi M, Aminorroaya A, Amini M. Association of lipid profile with Type 2 diabetes in first-degree relatives: A 14-year follow-up study in Iran. Diabetes Metab Syndr Obes. 2020; 13:2743-50. doi: 10.2147/DMSO.S259697, PMID 32801820. 27. Indu KC, Deo RK, Roka K, Singh P, Alam Z. Study of Lipid profile in patients with Diabetes Mellitus presenting at tertiary referral center in Nepal, MJSBH vol. Vol. 21(1, Jan-Jun); 2022. 28. Makris K, Spanou L. Is there a relationship between mean blood glucose and glycated hemoglobin? J Diabetes Sci Technol. 2011 Nov;5(6):1572-83. doi: 10.1177/193229681100500634, PMID 22226280. 29. The truth about triglycerides, health encyclopedia. University of Rochester Medical center. Available from: https://www.urmc.rochester.edu/encyclopedia/content.aspx?contenttypeid =56&contentid=2967 Published by: Longman Publishers www.jst.org.in Page | 16
Journal of Science and Technology ISSN: 2456-5660 Volume 8, Issue 08 (Aug-2023) www.jst.org.in DOI:https://doi.org/10.46243/jst.2023.v8.i08.pp1- 17 30. Mengyang H, Ling Y, Lu Z, Liu Y, Gu P, Shao J et al. Contribution and interaction of the low density lipoprotein cholesterol to high density lipoprotein cholesterol ratio and triglyceride to diabetes in hypertensive patients: A cross sectional study. J Diabetes Investig. 2019 Jan;10(1):131-8. Published online 2018 May 24. doi: 10.1111/jdi.12856, PMID 29694714. 31. Haas ME, Attie AD, Biddinger SB. The regulation of ApoB metabolism by insulin. Trends Endocrinol Metab. 2013 Aug;24(8). Published online May 27:391-7:391-7. doi: 10.1016/j.tem.2013.04.001, PMID 23721961. 32. Som K, Swaika BC, Pramanik S, Chakraborty P, Gantait K. Lipid profile in alcoholic and non-alcoholic patients of chronic liver disease A comparative and analytical study in a Ruralbased tertiary Care Center. J Assoc Phys India. 2019;67(4):22-4. PMID 31311213 Vol. 33. Mahaling DU, Basavaraj MM, Bika AJ. Comparison of lipid profile in different grades of nonalcoholic fatty liver disease diagnosed on ultrasound. Asian Pac J Trop Biomed. 2013;3(11, Nov):907-12. doi: 10.1016/S2221-1691(13)60177-X. 34. Mansour-Ghanaei R, Mansour-Ghanaei F, Naghipour M, Joukar F. Biochemical markers and lipid profile in nonalcoholic fatty liver disease patients in the Persian Guilan cohort study (PGCS), Iran. J Fam Med Prim Care. 2019 Mar;8(3):923-8. doi: 10.4103/jfmpc. PMID 31041226. 35. Kumari R, Kumar PS, Jana D. Dyslipidaemia in non-alcoholic fatty liver disease. IJSR. 2021:24-5. doi: 10.36106/ijsr/9739450. 36. Cuenza LR, Razon TLJ, Dayrit JC. Correlation between severity of ultrasonographic nonalcoholic fatty liver disease and cardiometabolic risk among Filipino wellness patients. J Cardiovasc Thorac Res. 2017;9(2):85-9. doi: 10.15171/jcvtr.2017.14, PMID 28740627. 37. Novakovic T, Mekic M, Smilic L, Smilic T, Ini -Kostic B, Jovicevic L et al. Anthropometric and biochemical characteristics of patients with nonalcoholic fatty liver diagnosed by non-invasive diagnostic methods. Med Arch. 2014 Feb;68(1):22-6. doi: 10.5455/medarh.2014.68.22-26, PMID 24783906. Published by: Longman Publishers www.jst.org.in Page | 17


