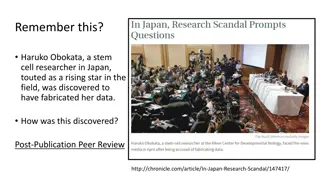
)peer reviewed scientific journals
Submission: Researchers submit their manuscripts detailing their studies, findings, and methodologies.Initial Assessment: The journal's editorial team conducts a preliminary review to determine if the submission fits the journal's scope and meets bas

Download Presentation

Please find below an Image/Link to download the presentation.
The content on the website is provided AS IS for your information and personal use only. It may not be sold, licensed, or shared on other websites without obtaining consent from the author. If you encounter any issues during the download, it is possible that the publisher has removed the file from their server.
You are allowed to download the files provided on this website for personal or commercial use, subject to the condition that they are used lawfully. All files are the property of their respective owners.
The content on the website is provided AS IS for your information and personal use only. It may not be sold, licensed, or shared on other websites without obtaining consent from the author.
E N D
Presentation Transcript
Journal of Science and Technology ISSN: 2456-5660 Volume 9, Issue 02 (Feb -2024) www.jst.org.in DOI:https://doi.org/10.46243/jst.2024.v9.i02.pp35- 46 Employee Satisfaction with Remuneration Dr.vikram valmikam Sachin Ramesh Thakre Assistant Professor Research scholar SVS Group of Institutions. OPJS University To Cite this Article Dr.vikram valmikam ,Sachin Ramesh Thakre, Employee Satisfaction with Remuneration Journal of Science and Technology, Vol. 09, Issue 02,- Feb 2024, pp35-46 Article Info Received: 10 -01-2024 Revised: 20-01-2024 Accepted: 4-02-2024 Published:15-2-2024 ABSTRACTThe pay that an employee gets in exchange for his or her service to the business is referred to as remuneration. The importance of pay in the life of an employee cannot be overstated. The compensation he or she gets determines his or her quality of life, social standing, motivation, loyalty, and productivity. Employee compensation is also important to the company since it influences production costs. Furthermore, numerous fights (in the form of strikes and lockouts) occur between the company and its workers over topics such as pay and bonuses. Employee compensation is also an essential element of human resource management. The HR professional has a tough job in determining appropriate salaries and compensation differentials for workers and supervisors. Because wages and salaries are such a hot topic, books and magazines dedicate a lot of space to in-depth studies of wage and compensation issues.One of a company's most significant investments is its compensation plan. Despite the fact that fair pay is a cornerstone of contractual and implicit agreements between workers and employers, the basic assumption is that money has a direct impact on behavior. Many workers and managers think that just raising compensation would encourage employees to perform harder and be more loyal. Employee performance is a significant problem for many companies, as they must recruit, inspire, and retain the appropriate talent pool in order to thrive (Cohenet al, 1992). In terms of establishing an atmosphere in which workers feel genuinely engaged, linked to the organization's goals and objectives, and happy with their employment, the need to recruit, motivate, develop, and retain people has never been more critical to any organization's success. Because workers must feel that their compensation is fair in proportion to the job they accomplish, the most important aspect of a payment plan is to guarantee that employees retain a high level of performance at work (Cohenet al, 1992). Furthermore, pay is one of the most important determinants of employee attitudes, motivation, and behavior (Wayne, 1992). The effect of compensation on employee behavior and attitudes, on the other hand, has centered on how pay is handled. The bulk of these research indicate that rewarding outstanding performance with large pay increases reinforces the behavior and makes it more likely to be repeated in the future, which is in line with reinforcement and expectation theories. The economy's overall health, the firm's financial ability to raise wages, union negotiations, and the desire to retain a key individual or group of employees, and the relative performance of a particular employee are all factors that influence a single pay rise. Furthermore, the information conveyed by a single pay shift, which may be affected by the aforementioned external variables, reveals more about an employee's worth to the company than the information offered by a pay level over time (Wayne, 1992). Compensation is also an important aspect of every company's human resources function. It's a dynamic profession that's also a labyrinth of complexities. INTRODUCTION: The pay that an employee gets in exchange for his or her service to the business is referred to as remuneration. The importance of pay in the life of an employee cannot be overstated. The compensation he or she gets determines his or her quality of life, social standing, motivation, loyalty, and productivity. Employee compensation is also important to the company since it influences production costs. Furthermore, numerous fights (in the form of strikes and lockouts) occur between the company and its workers over topics such as pay and bonuses. Employee compensation is also an essential element of 35 | P a g e www.jst.org.in
Journal of Science and Technology ISSN: 2456-5660 Volume 9, Issue 02 (Feb -2024) www.jst.org.in DOI:https://doi.org/10.46243/jst.2024.v9.i02.pp35- 46 human resource management. The HR professional has a tough job in determining appropriate salaries and compensation differentials for workers and supervisors. Because wages and salaries are such a hot topic, books and magazines dedicate a lot of space to in-depth studies of wage and compensation issues. NEED FOR THE STUDY To be acquainted with the operations of the organization's departments. Be familiar with the operations of several departments as well as the human resource management system. To be informed of the organization's present condition To get a better understanding of the company's employee pay and satisfaction policies. To gain knowledge of the resources accessible to laborers. OBJECTIVES OF THE STUDY To get a thorough understanding of how a company works. Gain a greater knowledge of how various departments operate. A study of the relationship between employees pays and job happiness. To achieve excellence, maintain a high degree of Discipline in sprite sugars. SCOPE OF THE STUDY In sprite sweets, a research was conducted on employee pay and satisfaction. To learn about the organization's employee compensation and happiness. METHODOLOGY Data collection method: Data was collected using both primary and secondary techniques. Interviews with sarita sugar workers provided primary data. Utilizing a questionnaire Observation is a useful tool for gaining information. Other sources of information: Textbooks on scientific research The organization's handbook Internet connection Methodologies for Sampling: Sarita workers make up the majority of the population. A list of all workers is used as the sample frame. 36 | P a g e www.jst.org.in
Journal of Science and Technology ISSN: 2456-5660 Volume 9, Issue 02 (Feb -2024) www.jst.org.in DOI:https://doi.org/10.46243/jst.2024.v9.i02.pp35- 46 Employees from the department were used as a model unit. The sample consisted of 100 workers. In this study, random sampling was used as the sampling technique. A personnel interview may be part of a plan. LIMITATIONS OF THE STUDY There is a time limit on the study; this research is unique to this business; and All of the respondents were unavailable at the time of the survey. The survey's accuracy is determined by the number of responses received since it is based on primary data. The study is mostly based on secondary sources, such as yearly reports from the business. As a consequence, claiming that the study is flawless is difficult when the bulk of it is dependent on secondary data. PROFILE OF SUGAR INDUSTRY In Sindh, Punjab, and the Northwest Frontier Province, sugarcane is extensively cultivated. For the agricultural community, it is a significant source of revenue and jobs. It accounts for 4.5 percent of total agricultural value added and 0.9 percent of gross domestic product. Punjab had the greatest average sugarcane production per acre of 690 maunds per acre in 2007-08, while the NWFP had the lowest at 566mds/acre. The average cane production per hectare has maintained between 45 and 50 tonnes in recent years, making it one of the lowest sugarcane-growing nations. Sugarcane yields are modest, with 500 to 800 mds/acre being typical. Due to inadequate management practices and post-harvest losses, the gap between potential and actual output is extremely wide. Traditional sugarcane management techniques are most often utilized, rather than automated ones, with labor as a significant input. Most farmers are ignorant of contemporary agricultural methods like as inter- culturing, fertilizer application, sprays, and appropriate irrigation, as well as how to correctly utilize farm yard manure (FYM). Sugarcane varieties: A study of Sind s sugarcane adoption showed THATTA-10 to be the most popular, accounting for 51.3 percent in 2006-07 and slightly decreasing to 49 percent in 2007-08. Other suggested varieties were BL-4 and SPSG-26, which had increases of 13.18 and 4.5 percent in 2006-07, and 15.96 and 6.60 percent the following cropping year. Because of their high sugar content, the cultivars BL-4 and THATTA-10 were chosen (above 18 percent). Gulabi-95, NIA-98, L-113, L-116, and PR-1000 were among the numerous types in the early phases of adoption. In 2006-07, non-recommended sugarcane cultivars were planted on around 23% of sugarcane land, and 22% of sugarcane land in 2007-08. HARISH DAMODARAN 21 September, New Delhi Despite the falling rupee and other factors, India's sugar exports are expected to decrease significantly in the 2008-09 crushing season (October-September). There is a worldwide supply shortage. Until September 15, the current season witnessed all-time high exports of 47.92 lakh tones (lt), made up of 27 lt of raw sugar and 21 lt of whites. OUTPUT ON A GLOBAL SCALE 37 | P a g e www.jst.org.in
Journal of Science and Technology ISSN: 2456-5660 Volume 9, Issue 02 (Feb -2024) www.jst.org.in DOI:https://doi.org/10.46243/jst.2024.v9.i02.pp35- 46 According to the International Sugar Organization, global sugar production would drop by 7.353 million tonnes (mt) in 2008-09, bringing the total to 161.649 mt for the first time since 2004-05. (ISO). Consumption, on the other hand, is expected to rise 2.35 percent to 165.547 million tonnes, leaving a 3.9 million tonne deficit (the figures are in raw value, with 1.08 tones raw equal to one tone of white). In its inaugural prediction of the global sugar balance, the London-based international organisation said, "The unique worldwide surplus period has gone, and the market is expected to shift into a deficit phase." Despite Brazil's 1.6 million tonnes increase, India (down 4.5 million tonnes), the European Union (2.90 million tonnes), Pakistan (1 million tonnes), Thailand (0.402 million tonnes), the United States (0.30 million tonnes), the Philippines (0.205 million tonnes), Mexico (0.20 million tonnes), Australia (0.18 million tonnes), and Russia (0.14 million tonnes) are all expected to see significant decreases. AN INCREASE IN THE COST OF BUYING Global futures pricing patterns reflect the reduced supply. For October 2008, raw sugar costs 11.70 cents per pound, 13.65 cents in March 2009, 13.96 cents in May 2009, 14.03 cents in July 2009, and 14.27 cents in October 2009. In December 2008, London white sugar was selling for $ 375.90 per tonne, $ 392.50 in May 2009, $ 403.20 in October 2009, and $ 418 in March 2010. However, rising global prices and a falling rupee (which has lost Rs 6.35 against the dollar at the end of March) may not be sufficient to boost exports. The reason for this isn't only the Centre's decision to scrap the export subsidy, which amounts to Rs 1,350 per tonne for mills in coastal states and Rs 1,450 per tonne for mills in the hinterland. At the current export price of $350 per tone, the subsidy loss of Rs 1,350-1,450 is more than offset by a gain of Rs 2,222 due to currency depreciation, according to a miller. He went on to say that improved domestic sales realisations were the primary reason of the export slowdown. THE IMPORTANCE OF SUGAR In return for future export promises, India's government promised to assist mills with raw sugar imports to alleviate the present sugar shortfall. Almost all sugar imported into India is currently raw sugar imported by mills for processing into refined sugar under the "Advanced Licensing Scheme" (ALS). Local sugar prices are presently far above international pricing, even after accounting for processing, shipping, and distribution expenses, as well as potential export commitments, therefore Indian mills are finding it profitable to import raw sugar to process and sell in the domestic market. In return for a future export commitment, mills are permitted to import raw sugar duty-free under the ALS. Mills are allowed to refine sugar and sell it domestically, but they must re-export 1.00 tonne of refined sugar for every 1.05 tonne of raw sugar received within 36 months. THEORETICAL FRAME WORK OF EMPLOYEE REMUNARATION The compensation plan adds to our understanding of reward systems. It covers everything from setting up computerized systems to ranking jobs, integrating performance-related pay, creating a flexible compensation structure, and implementing a pay policy, as well as providing guidance on how to build a job wage structure. For example, one employer appreciated the fact that he didn't require his employees to clock in since he, as the owner-manager, could determine if anybody was late just by looking at them (Herewith, 1991). "Because the individual may elude attention when they are simply one among many," he continues, "informal controls of this sort may be more effective than formal controls" (Herewith, 1991). According to Filippo (1994), the owner's readiness to transfer supervision and the organisation of a rising labour force are essential factors in the business's growth. 38 | P a g e www.jst.org.in
Journal of Science and Technology ISSN: 2456-5660 Volume 9, Issue 02 (Feb -2024) www.jst.org.in DOI:https://doi.org/10.46243/jst.2024.v9.i02.pp35- 46 The business will need to develop more complex ways to inspire individuals as the number of employees grows and the structure gets more organised. Profit-sharing plans have become one of the most common ways for bigger corporations to reward its workers. Companies, on the other hand, utilize payment techniques for improved performance because (Mills, 1994) claims that technological innovation is the only option to increase productivity, and that in the absence of such development, businesses "turn to incentives" to increase productivity. This is particularly true in businesses where labour expenditures account for a significant percentage of overall expenses. Employees benefit from performance-based compensation since it provides them with an extra source of income. Williams (1998) discovered that incentive scheme employees earned more than 11% more than other employees, that profit-sharing was not a substitute for other forms of pay, that profit-sharing was linked to both higher productivity and improved performance, and that individual goals, as well as participation and consultation in setting the target, must be accepted by the individual. COMPONENTS OF REMUNERATION: Employees in the organized sector are entitled to a variety of financial and non-financial benefits. A typical employee's pay package includes wages and salary, incentives, fringe benefits, perquisites, and non-monetary perks. SALARY AND WAGE: Wages are hourly rates of pay, while a salary are a monthly rate of pay, independent of the number of hours worked. Wages and compensation are increased on an annual basis. They differ for each employee and are based on the kind of job, seniority, and merit. DATA ANALYSIS AND INTERPRETATION Education of employees 39 | P a g e www.jst.org.in
Journal of Science and Technology ISSN: 2456-5660 Volume 9, Issue 02 (Feb -2024) www.jst.org.in DOI:https://doi.org/10.46243/jst.2024.v9.i02.pp35- 46 INTERPRETATION: SSLC is held by 21% of workers, PUC is held by 25%, Degree is held by 30%, and other courses are held by the remaining 24% of workers, according to the preceding table and graph. As a result, the overwhelming majority of them now have SSLC and PUC credentials. 2. How good is a sarita sugar to work? INTERPRETATION: According to the graph above, 16 percent of employees think their working circumstances are excellent, 39 percent think they are very good, 22 percent think they are good, and 23 percent think they are satisfied. 3. Are you satisfied you re job? 40 | P a g e www.jst.org.in
Journal of Science and Technology ISSN: 2456-5660 Volume 9, Issue 02 (Feb -2024) www.jst.org.in DOI:https://doi.org/10.46243/jst.2024.v9.i02.pp35- 46 INTERPRETATION: According to the table and graph above, 87% of workers are satisfied with their current position, while 13% are dissatisfied. As a result, the overwhelming majority of workers are content in their current jobs. 4. Do you feel insecure regarding job and salary? INTERPRETATION: According to the table and graph above, 27% of workers are always uncomfortable. Employees in 47 percent of cases have felt uneasy at work at some point. The remaining 26% of workers have never been worried about their job security. 41 | P a g e www.jst.org.in
Journal of Science and Technology ISSN: 2456-5660 Volume 9, Issue 02 (Feb -2024) www.jst.org.in DOI:https://doi.org/10.46243/jst.2024.v9.i02.pp35- 46 5. Satisfaction with salary being paid to you INTERPRETATION: According to the table and graph above, 62% of workers are satisfied with the company's compensation. The remaining 38% of workers are unhappy with their pay from the business. 6. Canteen facilities provided to you are good 42 | P a g e www.jst.org.in
Journal of Science and Technology ISSN: 2456-5660 Volume 9, Issue 02 (Feb -2024) www.jst.org.in DOI:https://doi.org/10.46243/jst.2024.v9.i02.pp35- 46 INTERPRETATION: Employees favour the creation of a canteen in 39 percent of cases, according to the table and graph above. The canteen has the support of 7% of the employees. Thirty percent of workers are dissatisfied with the facilities at the canteen. In addition, 24% of workers are very unhappy with the canteen facilities. The majority of workers dislike or are very unhappy with the canteen facilities. 7. Satisfaction with other facilities INTERPRETATION: According to the table and graph above, 95% of workers are happy with additional benefits like safety measures! The other amenities are unsatisfactory to management and 5% of workers. FINDINGS According to the table and graph above, 21% of employees have an SSLC, 25% have a PUC, 30% have a degree, and the other 24% have additional courses. As a result, the overwhelming majority of them now have SSLC and PUC credentials. 43 | P a g e www.jst.org.in
Journal of Science and Technology ISSN: 2456-5660 Volume 9, Issue 02 (Feb -2024) www.jst.org.in DOI:https://doi.org/10.46243/jst.2024.v9.i02.pp35- 46 According to the aforementioned data, 16 percent of employees think their working circumstances are exceptional, 39 percent think they are very good, 22 percent think they are good, and 23 percent think they are satisfied. According to the table and graph above, 87% of workers are satisfied with their current position, while 13% are dissatisfied. As a result, the overwhelming majority of workers are content in their current jobs. According to the data and graph above, 27% of workers feel continuously insecure. Employees in 47 percent of cases have felt uneasy at work at some point. The remaining 26% of workers have never been worried about their job security. According to the table and graph above, 62% of workers are satisfied with the company's compensation. The remaining 38% of workers are unhappy with their pay from the business. Employees favour the creation of a canteen in 39 percent of cases, according to the table and graph below. The canteen has the support of 7% of the employees. Thirty percent of workers are dissatisfied with the facilities at the canteen. In addition, 24% of workers are very unhappy with the canteen facilities. The majority of workers dislike or are very unhappy with the canteen facilities. According to the table and graph above, 95% of workers are pleased with other facilities, such as safety measures given by management, while 5% are dissatisfied with other facilities. According to the table and graph above, 54 percent of workers agree with and 46 percent highly approve of the medical facility offered by the business. The majority of the workers are covered under a contract with the medical institution. According to the table and graph above, 58 percent of workers agree, 35 percent strongly agree, 4% disagree, and 3% strongly disagree with fringe benefits. According to the table and graph below, 64% of workers are happy with the company's family welfare programme, while 36% are dissatisfied. According to the table and graph above, just 26% of workers have access to transportation, while the remaining 74% do not. According to the table and graph above, 100% of workers think that the business gives bonuses to all employees. According to the table and graph above, 96% of workers get their paychecks on time, while 4% do not. All workers are required to leave the premises, according to the table and graph above. The table and graph above show that 77 percent of workers are granted paid time off while working for the business. Furthermore, last year, 23% of workers did not get paid time off. SUGGESTIONS Based on the findings of this poll, I've identified a few areas where employee compensation and happiness may be improved, resulting in greater employee performance. Furthermore, the organization's goal must be fulfilled. According to the results, 21% of employees have an SSLC and 25% have a PUC, indicating that competent and experienced personnel should be prioritised. Prioritize increased employee involvement in business management. To assist in the job hunt. According to the study, 38% of workers are unhappy with the salary they get from their employers. Salary should be determined using a combination of performance and credentials. 44 | P a g e www.jst.org.in
Journal of Science and Technology ISSN: 2456-5660 Volume 9, Issue 02 (Feb -2024) www.jst.org.in DOI:https://doi.org/10.46243/jst.2024.v9.i02.pp35- 46 Employees should have access to a can facility at work. The business may offer additional incentives and incentive programmes to motivate workers. It is appropriate to commend work that is both efficient and productive. It is necessary to establish a distinct department for human resource development. Workers in their profession should be trained by the company. To progress toward a quality goal of complete customer satisfaction, the company must use modern technology and quick equipment in the manufacturing process. CONCLUSION General administration, finance and accounting, sale and store, generation, distillation, mechanical, godawon and purchase, labour welfare office, Time office, watch and ward cane yard, engineering department, and agricultural department are among the company's departments. Employee compensation and satisfaction are important to the human resource department. All of these divisions are actively working toward the factory's aims and objectives, according to the research. The business continues to expand at a fast rate year after year thanks to the management's efficiency. Employees at Sarita Sugar are paid on a monthly basis. Dissatisfaction with the canteen and family welfare programme providing excellent canteen and family welfare scheme, taxi facility improving knowledge of the company's objectives and resource usage, since they are presently underutilised when the plant is doing well. BIBLIOGRAPHY QUESTIONNAIRE 1) Education of employees ( ) SSLC PUC DEGREE OTHER COURCES 2. How good is a sarita sugar to work? ( ) Exceptionally good Very good Good Satisfactory 3. Are you satisfied your job? ( ) Yes No 4. Do you feel insecure regarding job and salary? ( ) Always Sometimes Never 5. Are you satisfied with salary being paid to you? ( ) Yes No 6. Canteen facilities provided to you are good? ( ) Agree Strongly agree Disagree Strongly disagree 7. Are you satisfied with other facilities? ( ) Yes No 8. The Medical facilities provided to you are good? ( ) Agree Strongly agree 9. Fringe benefits given to you are good? ( ) Agree Strongly agree Disagree Strongly disagree 45 | P a g e www.jst.org.in
Journal of Science and Technology ISSN: 2456-5660 Volume 9, Issue 02 (Feb -2024) www.jst.org.in DOI:https://doi.org/10.46243/jst.2024.v9.i02.pp35- 46 10. Is there any Family welfare scheme provided to you? ( ) Yes No 11. Is there any transportation facility provided by your company? ( ) Yes No 12. Does your company credits your salary within prescribed time? Yes No 13. Does Your Company paying bonus? ( ) Yes No 14. Do you have leave facility? ( ) Yes No 15. Does your Company encashing earn leave during last year? ( ) Yes No 46 | P a g e www.jst.org.in