peer reviewed scientific journals
Submission: Researchers submit their manuscripts detailing their studies, findings, and methodologies.Initial Assessment: The journal's editorial team conducts a preliminary review to determine if the submission fits the journal's scope and meets bas
Download Presentation

Please find below an Image/Link to download the presentation.
The content on the website is provided AS IS for your information and personal use only. It may not be sold, licensed, or shared on other websites without obtaining consent from the author. If you encounter any issues during the download, it is possible that the publisher has removed the file from their server.
You are allowed to download the files provided on this website for personal or commercial use, subject to the condition that they are used lawfully. All files are the property of their respective owners.
The content on the website is provided AS IS for your information and personal use only. It may not be sold, licensed, or shared on other websites without obtaining consent from the author.
E N D
Presentation Transcript
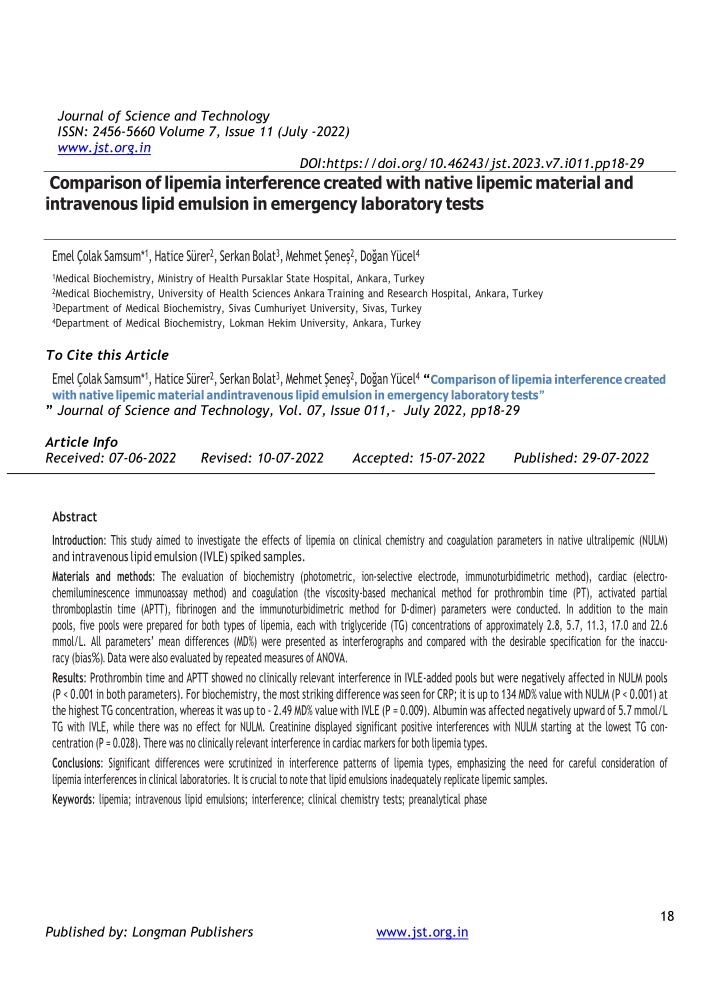
Journal of Science and Technology ISSN: 2456-5660 Volume 7, Issue 11 (July -2022) www.jst.org.in DOI:https://doi.org/10.46243/jst.2023.v7.i011.pp18-29 Comparison of lipemia interference created with native lipemic material and intravenous lipid emulsion in emergency laboratory tests Emel olak Samsum*1, Hatice S rer2, Serkan Bolat3, Mehmet ene 2, Do an Y cel4 1Medical Biochemistry, Ministry of Health Pursaklar State Hospital, Ankara, Turkey 2Medical Biochemistry, University of Health Sciences Ankara Training and Research Hospital, Ankara, Turkey 3Department of Medical Biochemistry, Sivas Cumhuriyet University, Sivas, Turkey 4Department of Medical Biochemistry, Lokman Hekim University, Ankara, Turkey To Cite this Article Emel olak Samsum*1, Hatice S rer2, Serkan Bolat3, Mehmet ene 2, Do an Y cel4 Comparison of lipemia interference created with native lipemic material and intravenous lipid emulsion in emergency laboratory tests Journal of Science and Technology, Vol. 07, Issue 011,- July 2022, pp18-29 Article Info Received: 07-06-2022 Revised: 10-07-2022 Accepted: 15-07-2022 Published: 29-07-2022 Abstract Introduction: This study aimed to investigate the effects of lipemia on clinical chemistry and coagulation parameters in native ultralipemic (NULM) and intravenous lipid emulsion (IVLE) spiked samples. Materials and methods: The evaluation of biochemistry (photometric, ion-selective electrode, immunoturbidimetric method), cardiac (electro- chemiluminescence immunoassay method) and coagulation (the viscosity-based mechanical method for prothrombin time (PT), activated partial thromboplastin time (APTT), fibrinogen and the immunoturbidimetric method for D-dimer) parameters were conducted. In addition to the main pools, five pools were prepared for both types of lipemia, each with triglyceride (TG) concentrations of approximately 2.8, 5.7, 11.3, 17.0 and 22.6 mmol/L. All parameters mean differences (MD%) were presented as interferographs and compared with the desirable specification for the inaccu- racy(bias%).DatawerealsoevaluatedbyrepeatedmeasuresofANOVA. Results: Prothrombin time and APTT showed no clinically relevant interference in IVLE-added pools but were negatively affected in NULM pools (P < 0.001 in both parameters). For biochemistry, the most striking difference was seen for CRP; it is up to 134 MD% value with NULM (P < 0.001) at the highest TG concentration, whereas it was up to - 2.49 MD% value with IVLE (P = 0.009). Albumin was affected negatively upward of 5.7 mmol/L TG with IVLE, while there was no effect for NULM. Creatinine displayed significant positive interferences with NULM starting at the lowest TG con- centration (P = 0.028). There was no clinically relevant interference in cardiac markers for both lipemia types. Conclusions: Significant differences were scrutinized in interference patterns of lipemia types, emphasizing the need for careful consideration of lipemia interferences in clinical laboratories. It is crucial to note that lipid emulsions inadequately replicate lipemic samples. Keywords: lipemia; intravenous lipid emulsions; interference; clinical chemistry tests; preanalytical phase 18 Published by: Longman Publishers www.jst.org.in
Journal of Science and Technology ISSN: 2456-5660 Volume 7, Issue 11 (July -2022) www.jst.org.in DOI: https://doi.org/10.46243/jst.2022.v7.i11.pp18-28 Introduction Interference is an effect that causes a clinically sig- nificant error in the measured analyte concentra- tion due to the nature of the sample or another substance present in the sample (1). Lipemia is a rare but essential type of interference in the pre- analytical phase(0.5-2.5%)(2).The mostcommon causes of lipemia are impaired fasting, diet, alco- hol intake, lipid metabolism disorders, total paren- teral nutrition, some drugs and chronic diseases, such as diabetes mellitus, chronic renal failure and hypothyroidism (3). Lipemia-induced interference mechanisms are light scattering, light absorbance, electrolyte exclusion, partitioning of the analytes between polar and non-polar phases, physico- chemical and biological effects (2). Lipoprotein particles can cause turbidity leading to light scat- tering. Consequently, lipemia can lead to substan- tial interference in photometers, specifically in tur- bidimetric and nephelometric methods based on light scattering (4). Light scattering can occur in all directions and its intensity depends on the num- ber and size of lipoprotein particles and the mea- surement wavelength. Chylomicrons and very low-density lipoproteins (VLDL) are the primary factorsresponsibleforturbidity(5,6).Moreover,li- poprotein particles can affect all results by leading to light absorbance in the 300-700 nm, where pho- tometric measurements are conducted. However, absorbance is inversely proportional to the wave- length. As a result, lipemia tends to have a more substantial effect on methods that use lower wavelengths (2). In interference studies, bilirubin and hemoglobin are added to the samples when evaluating icterus and hemolysis. Currently, we have no standard material to mimic native lipemia due to the het- erogeneity of lipoproteins (7,8). Glick and col- leagues used Intralipid (Fresenius Kabi, Bad Ham- burg, Germany), one of the most commonly used intravenous lipid emulsion (IVLE) solutions, to cre- ate lipemic samples (9). However, IVLE solutions contain different components from native lipemic serum/plasma, such as soybean oil, egg yolk phos- pholipids and glycerin (10). One notable limitation of Intralipid is its particle size, with an average of 345 nm and a range from 200 to 600 nm. There- fore, it does not comprise large chylomicrons (up to 1000 nm) and large VLDL particles (35-200 nm). Moreover, the particles refractiveindexinIntralip- id differs from lipoproteins (8). It is crucial to ac- knowledge that the composition and characteris-tics of synthetic lipid emulsions can vary and not all of them share the same limitations as Intralipid. Previous studies have shown conflicting results between the use of intralipid emulsions and natu- ral lipemia (11-13). Most of the interference studies have been done with IVLE and lipemia interfer- ence in commercial products is also based on IV- LE-spiked studies. Studies with native lipemic sam- ples are limited (12,14-17). This study aimed to investigate the effects of lipe- mia on clinical chemistry and coagulation param- eters in native lipemic and IVLE spiked samples. Based on former studies, we hypothesized that natural lipemia would affect these parameters dif- ferently. Therefore, we planned to prepare an ul- tralipemic material from lipemic patient sera to mimic native lipemia (18). Materials and methods This study was conducted in the Emergency Labo- ratory of the Biochemistry Department at Ankara Research and Application Center in accordance with the EP7-A2 and C56-A protocols by the Clini- cal and Laboratory Standards Institute (CLSI) (1,19). The study protocol was prepared following the Helsinki Declaration and approved by the Health Sciences University Ankara Training and Research Hospital Clinical Research Ethics Committee (Deci- sion No:295/2020;10.07.2020). Published by: Longman Publishers www.jst.org.in
Journal of Science and Technology ISSN: 2456-5660 Volume 7, Issue 11 (July -2022) www.jst.org.in DOI: https://doi.org/10.46243/jst.2022.v7.i11.pp18-28 Preparation of stock interferents solutions Two interferents, commercial lipid emulsion (Olicli- nomelN-7,1000E(20%,BaxterInc.Lessines,Bel- gium)) and the native ultralipemic material (NULM) prepared in-house,were used.To prepareNULM,a 100 mL serum pool was collected from approxi- mately 40 residual lipemic serum samples (BD Va- cutainer the lipids (20). Then, this pool was centrifuged three times at 45,000xg for 30 minutes in a Hanil Supra 21K (Hanil Scientific Inc., Gimpo, South Ko- rea) refrigerated high-speed centrifuge. After each centrifugation, the supernatant lipid layer was col- lected carefully. Subsequently, only this lipid-rich portion underwent centrifugation in the following step. At the end of the third collection, we had 5mL of NULM. Preparation of sample pools Two 50 mL serum pools were prepared by collect- ing 40 fresh and non-turbid residual serums (Vacu- tainer SST II Plus, 5 mL, Becton Dickinson, Franklin Lake, USA) with TG concentration < 0.99 mmol/L; one pool was designated for biochemical analytes, while the other was intended for cardiac analytes. All analyzed tests were within the reference range. Likewise, 20 residual plasma (4.5 mL, Becton Dick- inson, Franklin Lake, USA), with coagulation ana- lytes within reference ranges and no visible tur- bidity, were collected. A 50 mL plasma pool was prepared. The pools were stored at 2-8 C. Bio- chemical and cardiac analytes were measured within seven days and coagulation analytes were measured within four hours. Addition of native ultralipemic material and intravenous lipid emulsion to pools According to the CLSI guideline C56-A, the highest TG concentration in the pools was determined to be 22.6 mmol/L by evaluating the high TG con- centrations observed in lipemic samples in our laboratory. The stock solutions (NULM and IVLE) were concentrated at least 20 times the target concentration and when spiking, dilutions did not exceed 5% to minimize the deterioration of the sample matrices. For the first pools, 7.6 mL base- line pools spiked with 0.4 mL stock solutions. The remaining baseline pools were diluted with dis- tilled water at the same ratio (1/20) to compensate for pools dilutions. Five pools were prepared for both NULM and IVLE types of lipemia by taking samples in the amounts indicated in Figure 1 from the first and baseline pool tubes. Each pool was designed to have a different TG concentration, ap- proximately 2.8, 5.7, 11.3, 17.0 and 22.6 mmol/L (Figure 1). Investigated analytes In the serum pools N-terminal pro brain natriuretic peptide (NT-proBNP), creatine kinase MB isoen- 22 Published by: Longman Publishers www.jst.org.in
Journal of Science and Technology ISSN: 2456-5660 Volume 7, Issue 11 (July -2022) www.jst.org.in DOI: https://doi.org/10.46243/jst.2022.v7.i11.pp18-28 1. POOL 7.6 mL baseline pool 3. POOL 4 mL 1. pool + 4 mL 5. POOL 2 mL 4. pool + 2 mL + 3 mL BASELINE POOL BASELINE Diluted with 2. POOL 1.5 mL pool + 1.5 mL pool TRIG: 17 mmol/L (3/4) Stock Solutions 4. POOL 3 mL 3. pool FIGURE 1. Flow chart of preparation of pools with different triglyceride (TG) concentrations. NULM - native ultralipemic material. IVLE - intravenous lipid emulsion. zyme mass (CK-MB) and high-sensitivity troponin T (hs-TnT) were investigated by the sandwich-type electrochemiluminescence immunoassay (ECLIA) method on the Roche Cobas e411 (Roche, Basel, Switzerland) analyzer. Also, biochemical analytes measured by Roche Co- bas 6000 c501 (Roche, Basel, Switzerland) and ABL800-FLEX blood gas analyzer (Radiometer Medical ApS, Copenhagen, Denmark) are given in Table 1. In the citrated plasma pool, prothrombin time (PT), activated partial thromboplastin time (APTT), fi- brinogen (Fbg) and D-dimer (DD) were investigat- ed on the Stago STAR Max (Diagnostica Stago SAS, Asni res Sur Seine, France) analyzer. D-dimer was also measured on Roche Cobas 6000 c501 analyz- er (Roche, Basel, Switzerland). Fibrinogen, PT and APTT were measured using the viscosity-based mechanical method and DD was measured using the immunoturbidimetric method in both analyz- ers. Lipid and serum index measurements Triglyceride, total cholesterol (CHOL), high-density lipoprotein cholesterol (HDL), low-density lipopro- tein cholesterol (LDL) and serum index measure- ments were performed on the Roche Cobas 8000 c702 (Roche, Basel, Switzerland) analyzer to deter- mine the degree of lipemia and turbidity in the pools (Table 1, Supplementary table 1). Further- more, lipoprotein gel electrophoresis for NULM was conducted (Sebia Hydrays, Paris, France). Statistical analysis IBM SPSS Statistics Windows version 22.0 (IBM Corp., Armonk, New York, USA) program was used for statistical analysis. The data distribution was determined by Shapiro-Wilk tests and by examin- ing histogram graphs. Parametric data were given as mean SD. A repeated measure ANOVA test was used to determine whether there was a signif- icant difference between the pools for all analytes. The statistical significance level was considered as P < 0.05. Microsoft Excel (Microsoft Corp., Red- mond, USA) was used to prepare interferographs. In the study, the analytes were measured three times in each pool and the averages of these mea- surements were used in the calculations. For each analyte, the mean percentage difference (MD%) in lipid-added pools relative to the baseline pool was calculated, MD = [(C1 - C0) / C0] x 100; (C1, mean an- alyte concentration in the lipid-added pool; C0, mean analyte concentration in baseline pool). In- terferographs were arranged the way interferent concentrations were on the x-axis, MD% values were on the right side of the y-axis and mean val- ues of analytes were on the left side of the y-axis. Significant interference was considered when the MD exceeded the desirable specification for inac- curacy ( bias%) obtained from the biological vari- ation data, which was Published by: Longman Publishers www.jst.org.in
Journal of Science and Technology ISSN: 2456-5660 Volume 7, Issue 11 (July -2022) www.jst.org.in DOI: https://doi.org/10.46243/jst.2022.v7.i11.pp18-28 available from a database formed by Ricos et al. (21). Desirable total allow- able error (TEa) derived from intra- and inter-indi- vidual biological variation data might serve to as- sess the clinical relevance of interference, encom- passing two crucial components: desirable bias and desirable imprecision. In interference studies involving multiple measurements for each pool, the impact of imprecision is minimized. Conse- quently, as in this study, desirable bias values func- tion as a practical interference budget. Results The concentrations of TG in stock interferent solu- tions were 469 and 501 mmol/L for NULM and IVLE, respectively. The lipoprotein electrophoresis for NULM revealed the following composition: 12% chylomicron,63%LDL,8.6%VLDLand 15% HDL. The measurements of all analytes in baseline pools and the corresponding calculated MD% values for all lipid concentration are outlined in Table 2. Lipemia interferographs are shown in Figures 2, 3 and 4. Significant negative interferences were detected for PT and APTT in NULM spiked pools which were proportional to TG concentrations (in both P < 0.001). In contrast, significant positive inter- ference for PT was determined in IVLE spiked pools (P = 0.017), but the interference level did not exceed the bias% limit up to TG concentra- tions of 22.6 mmol/L. 24 Published by: Longman Publishers www.jst.org.in
Journal of Science and Technology ISSN: 2456-5660 Volume 7, Issue 11 (July -2022) www.jst.org.in DOI: https://doi.org/10.46243/jst.2022.v7.i11.pp18-28 TABLE 1. Investigated biochemistry parameters and methodology Wavelength Analytes Methodology (sub/main, nm) Roche Cobas 6000 c501 Alb Bromocresol green (BCG) 505/570 700/340 700/340 ALT IFCC, UV, without P5P AST IFCC, UV, without P5P AMY IFCC, 4,6-ethylidene-(G7) p-nitrophenyl-(G1) -D-maltoheptaoside (ethylidene-G7PNP) 700/415 CREA Compensated Jaffe method 570/505 DBIL Diazo method 800/546 TBIL Diazo method 600/546 376/340 Ca 5-nitro-5 -methyl-BAPTA (NM-BAPTA) method CHE Butyrylthiocholine 700/415 700/340 LD IFCC, UV, Lactate-pyruvate conversion GGT IFCC, L- -glutamyl-3-carboxy-4-nitroanilide (GGCN) 700/415 700/340 546/340 Glc Hexokinase CK IFCC, UV, NAC activated Mg Xylidyl blue 505/600 700/340 Phos UV, Ammonium molybdate TP Biuret method 700/546 UA Enzymatic, uricase 700/546 700/340 Urea UV, Urease/Glutamate dehydrogenase (GLDH) CRP Immunoturbidimetric 800/570 Na, K, Cl Indirect ISE / Radiometer ABL800 FLEX Na, K, Ca2+ Direct ISE / Roche Cobas 8000 c702 TG Enzymatic method (using glycerol blank) 700/500 CHOL Cholesterol esterase, oxidase, peroxidase 700/505 HDL Homogeneous colorimetric method 700/600 Published by: Longman Publishers www.jst.org.in Serum index Absorbance measurements at bichromatic wavelength pairs LDL Homogeneous colorimetric method 700/600 For lipemia 700/660
Journal of Science and Technology ISSN: 2456-5660 Volume 7, Issue 11 (July -2022) www.jst.org.in DOI: https://doi.org/10.46243/jst.2022.v7.i11.pp18-28 and two lipemia types: native ultralipemic material (NULM) and intravenous lipid emulsion (IVLE) TABLE 2. Mean percentage difference (MD%) between baseline pool and lipid spiked pools for different triglyceride concentrations P P Bias (%)** TG, mmol/L 2.8 5.7 11.3 17.0 22.6 2.8 5.7 11.3 17.0 22.6 PT, sec 12.1 0.1 - 1.4 - 2.5* - 4.9 - 6.6 - 9.3 < 0.001 0.0 1.1 1.1 1.4 1.7 0.017 2 APTT, sec 33.3 0.6 - 4.5* - 8.2 - 11.8 - 15.3 -18.2 < 0.001 0.1 0.2 0.9 1.3 1.3 0.601 2.3 Fbg, g/L 3.2 0.1 0.9 3.4 0.0 - 2.9 2.3 0.307 1.3 1.1 - 1.2 - 1.8 0.0 0.728 4.8 DD (Stago), mg/L 0.63 0.08 - 2.7 8.5 16 14.4 - 17 0.270 - 5.3 - 5.9 6.4 7.5 - 4.3 0.793 8.82 DD (Roche), mg/L 0.64 0.01 - 2.6 - 4.2 - 0.5 - 9.4 0.0 0.465 - 2.1 - 0.5 0.5 - 2.1 - 4.7 0.465 8.82 CK-MB,ng/mL 2.4 0.03 2.7 3.4 3 3.4 2.3 0.648 -2.2 -0.7 -0.5 2.1 -1.0 0.07114.88 NT-proBNP, ng/L 834 16.5 1.9 0.4 2.8 3.5 2.2 0.299 0.5 2.6 1.5 1.5 2.9 0.295 4.7 hs-TnT, ng/L 14 0.2 - 7.1 - 10.7 - 2.3 - 4.1 0.7 0.123 - 4.6 - 5.8 - 4.2 - 9.7 - 1.9 0.006 23.7 Alb,g/L 42.6 0.3 1.80 -0.31 -0.63 -0.55 1.33 0.04 -0.63 -2.35* -7.75 -10.33 -14.95<0.0011.43 ALT, U/L 11 2 2.06 - 22 (A) - 61 (A) A A 0.007 2.06 - 40 (A) - 58 (A) - 54 (A) A < 0.001 11.48 AST, U/L 13 1 - 5.76 - 30 (A) - 75 (A) A A < 0.001 - 1 - 28 (A) - 65 (A) A A 0.001 6.54 AMY,U/L 63 0 1.06 1.59 5.29 5.82 8.47* <0.001 0.53 1.06 2.12 3.17 3.70 0.003 7.4 CREA, mol/L 59 2 6.53* 5.03 7.54 6.03 9.05 0.028 2.01 0.00 -3.02 -0.50 2.51 0.749 3.96 DBIL, mol/L 2.2 0.2 35* 75 128 184 333 < 0.001 59* 98 174 254 309 < 0.001 14.2 TBIL, mol/L 5 1 0.97 - 16.3 2.47 4.19 - 9.77 0.809 10.3 - 9.56 - 20.2 - 17.3 8.92 0.183 8.95 Ca, mmol/L 2.29 0.01 1.30* 0.76 2.21 3.37 4.78 0.001 1.92* - 0.51 0.11 - 0.76 - 1.23 0.021 0.82 CHE, U/L 7252 91 1.73 1.42 3.19 3.45 3.20 0.011 0.82 - 0.31 - 0.83 - 1.20 - 0.60 0.101 4.8 LD, U/L 152 1.5 - 0.22 - 0.22 3.52 4.18 3.50 0.01 1.10 - 0.88 - 0.66 - 2.20 - 2.42 0.126 4.3 GGT, U/L 17 1 6.00 2.00 6.00 2.00 0.00 0.141 8.00 4.00 6.00 6.00 4.00 0.491 11.06 Glc, mmol/L 5.1 0 2.17 4.35* 6.16 8.00 13.41 < 0.001 1.81 2.54* 3.99 3.90 5.43 < 0.001 2.34 CK, U/L 79 0 - 1.69 0.84 1.69 0.84 4.60 0.016 - 1.27 - 1.27 - 1.69 - 1.69 - 2.53 0.772 11.5 Mg, mmol/L 0.81 0.01 0.00 1.23 2.88* 2.47 4.53 0.001 1.65 0.41 1.65 - 0.41 - 0.82 0.016 1.8 Phos, mmol/L 1.12 0.03 -0.57 -1.34 -1.44 -2.49 -2.30 0.570 -1.15 -2.78 -4.02* -6.60 -1.24 0.005 3.38 UA, mmol/L 0.24 0.01 - 1.63 0.81 0.00 1.63 1.63 0.620 - 4.07 - 2.44 - 0.81 - 5.69* - 5.69 0.272 4.87 Urea, mmol/L 4.3 0.1 - 0.13 2.49 4.32 2.75 3.80 0.004 1.31 - 0.52 - 0.52 - 1.18 - 3.01 0.150 5.57 CRP, mg/L 36.1 0.2 16.2 30.4* 60.7 89.8 133.6 < 0.001 0.83 - 1.48 - 1.39 - 1.57 - 2.49 0.009 21.8 Na (I-ISE), mmol/L 130 0.6 0.77* 1.79 2.56 3.58 4.35 < 0.001 0.51* 0.51 0.26 - 0.51 - 0.51 0.022 0.23 Published by: Longman Publishers www.jst.org.in
Discussion This study aimed to assess the differences in inter- ferences induced by natural lipemia and those caused by IVLE in diverse analytes. Our investiga- tion revealed variations in interference patterns between natural lipemia and IVLE across most pa- rameters, aligning with our initial hypothesis and showcasing differences in either direction, magni- tude or both. Lipemia causes interferences in coagulation pa- rameters with different mechanisms such as an- alytical effects, primarily seen in optical meth- ods, biological effects and direct alteration of primary and secondary hemostasis components providing a contact surface. Active products from this pathway (factor XIIa, factor IXa) can trigger factor VII, a significant component of the extrinsic pathway (25,26). The second one is that the movement of the magnetic bead might be mechanically restricted due to the increased vis- cosity. In our study, DD was measured in two different analyzers using the immunoturbidimetric meth- od. Since lipemia primarily causes interference through light absorbance and scattering, turbi- dimetric and nephelometric methods are ex- pected to be the most affected (2,4,27). Howev- er, in reviewing the literature, there are studies in which DD measurement is unaffected (28,29). Al- though measured by immunoturbidimetric method, we did not observe any significant in- terference, similar to these studies. Studies with natural lipemic materials at different DD concen- trations are needed to clarify this issue. C-reactive protein is another immunoturbidi- metric test. Similar to the effect of DD, it is stated in the literature and the kit inserts that there was no interference up to 1000 lipemia index for CRP measurement (7). However, our study observed significant positive interference with NULM commencing at the lowest TG concentration and proportional to TG concentration. The fact that one of the immunometric measurements is affected while the other is not may be because the analyses are performed at different wave- lengths. On the Roche analyzer, DD is measured at 800 nm and CRP is measured at 570 nm. C-re- active protein, which is measured at lower wave- length, is affected by lipemia. Cardiac parameters were determined by ECLIA, based on sandwich immunoassay, which con- tains two antibodies and has detailed washing steps (30). Due to these features, its sensitivity is high, and it has been observed that there is no lipemia interference as in previous studies (31,32). It was also consistent with the manufac- turer s declaration, which says there is no inter- ference up to the 1500 lipemia index value (Sup- plementary table 2).Interference evaluations were made for bio- chemistry parameters using IVLE on the Roche Cobas 6000 analyzer and these data were pub- lished before (31,32). Our results were evaluated by comparison with these studies and, where available, with test- based studies. Statistically and clinically significant negative in- terference was detected for alanine aminotrans- ferase (ALT) and aspartate aminotransferase (AST), consistent with previous studies (14,31,32). When lipemia index values were 159 and 174 for NULM and IVLE, respectively, the negative inter- ference amount exceeded the 10% limit, con- forming to the manufacturer s declaration (Sup- plementary table 2). As in the Zeng et al. study, IVLE was observed to cause a sharper decrease in ALTthanNULM(2%to- 40%, 2%to- 22%,re- spectively) (14). In future studies, preparing an additional pool of 2.8 and 5.7 mmol/L TG will help determine the interference initiation point in more detail. As the turbidity increased, no re- sults were obtained because no signal could be received from the device. This started at lower TG concentrations with NULM than IVLE. Inter- ference data are given in kit inserts according to IVLE. This means that in practice results cannot be obtained from more patients because of not receiving signals. Published by: Longman Publishers www.jst.org.in
Studies on positive or negative interferences of AMY have been reported in the literature (using IVLE) (33,34). It has been reported in the kit pack- age insert that it will be negatively affected after the 1500 lipemiaindex(10%).Inour study,upto approximately 600 lipemia index values were examined in the highest pool. Contrary to the manufacturer s declaration, we observed posi- tive interference with both types of lipemia. Spe- cifically, the NULM pool showed positive inter- ference atanindexof 600, surpassingthebias%, although not exceeding the 10% limit (Supple- mentary table 2). The interference of lipemia is expected to in- crease as the wavelength decreases and the tests performed in the ultraviolet (UV) region are more affected (8). While this effect was observed for ALT and AST measured in the UV region, this distinction was not fully observed for some oth- er tests. While gamma-glutamyltransferase (GGT) and CHE measured in the visible region were not affected by lipemia as expected, contrary to ex- pectations, CK and LD measured in the UV re- gion were unaffected by lipemia. These differ- ences may be because the ratio of the sample volume used in the reaction to the total reaction volume differs between biochemistry analytes. No interference exceeding the 10% limit was ob- served for CK, LD, GGT and CHE in the IVLE pools, confirming the kit data up to 600 lipemia index. Nevertheless, LD displayed statistically signifi- cant positive interference in NULM pools, con- trary to the manufacturer s declaration (Supple- mentary table 2). Negative or positive interferences have been shown in the literature for Ca, Mg and inorganic phosphate depending on the device, method and reagents (3,33-35). Although significant neg- ative interference was observed in all three, we did not observe any interference exceeding the 10% limit with IVLE, which is consistent with the kit insert. Phosphorus was not significantly af- fectedby NULM, CameasuredintheUVregion was significantly positively affected as expected, while Mg measured in the visible region was positively affected, similar to other studies in the literature, contrary to expectations (31,32,34). Studies show that Alb is negatively or positively affected or not. The kit insert observed signifi- cant negative interference with IVLE (31,32,34,35). Our findings were compatible with the manu- facturer declaration in the IVLE pool. Negative interference observed in our study outstripped the 10% limit at similar lipemia index values in the insert (478 and 550, respectively) (Supple- mentary table 2). In contrast, no clinically signifi- canteffectwas observedwithNULM,although statistically significant. Previous studies using IVLE for CREA have re- ported generally negative interference. The kit data published by Roche Diagnostics states that after the lipemia index value of 800, variable in- terference can be observed in the positive or negative direction (3,7,34). Ali et al. observed this
biphasic effect in CREA in their study in which they evaluated lipemia interference using IVLE in 24 biochemistry parameters on a Roche Cobas 6000 analyzer (32). In our study, maximum lipe- mia index values of 614 and 633 were reached in pools with NULM and IVLE added. No effect was observed in the IVLE pool, consistent with the kit insert. A positive effect was observed in the NULM pool starting from 2.8 mmol/L TG. It was thought that an increase in CREA was detected similar to that of Ali et al. but at lower concentra- tions withNULM. In direct bilirubin (DBIL), interference was ob- served in both types of lipemia, consistent with those reported in previous studies (7,31). This in- terference in DBIL exceeded the 10% limit even at the lowest TG concentration (2.8 mmol/L, around a lipemia index of 90), far below the 750 reported in the kit insert. This effect in DBIL may be due to the minor differences between absor- bance measurements. Negative and positive interferences have been reported for glucose in several studies. In our study, positive interferences consistent with the kit insert were observed in both types of lipe- mia. However, interference was higher with NULM than IVLE and had an early onset, passing the 10% limit at 633 lipemia index value, which is lower than the index value of 1000 given in the manufacturer declaration (32,34,35). In clinical laboratories, electrolytes are most of- ten measured by the potentiometric measure- ment method based on ISE. Blood gas analyzers measure directly without dilution, while autoan- alyzers use the indirect method of diluting sam- ples before measurement. In this method, con- ditions such as lipid disorders and hypo- or hy- perproteinemia may lead to incorrect readings of electrolyte results due to the electrolyte ex- clusion effect . In cases of hyperlipidemia and hyperproteinemia, Na, K and Cl are measured as falsely low by the indirect method, whereas the direct method is unaffected (2). As in the study of Chopra et al., Na and K values measured by the direct method were higher than the autoan- alyzer results (36). Contrary to the information in the literature and manufacturer declaration, positive interference was observed with both methods in pools to which NULM was added. Al- though TG concentrations are close, CHOL, HDL and LDL concentrations of NULM are approxi- mately ten times higher than those of IVLE (Sup- plementary table 3). In this case, it was thought there must be another effect from exclusion that the electrode response may have changed due to the contamination of the ion-bound mem- brane surface with these compounds in both methods (37). In future studies, pools prepared with NULM should also be examined more thor- oughly by measuring non-TG lipid concentra- tions. This study has some limitations. Firstly, the amount of NULM we prepared was limited due to the small number of lipemic samples. Therefore, we could only evaluate the analytes at a single medical decision concentration. It will be more en- lightening to evaluate different concentrations in future studies. Secondly, we could not evaluate how TG concentrations > 22.6 mmol/L will affect analytes due to the small number of samples and difficultiesin preparing NULM. In conclusion, our study compared interferences caused by natural lipemia and lipid emulsion across multiple analytes. It is crucial to note that IVLE does not accurately replicate lipemic patient samples. Significant differences were observed in interference patterns, reinforcing the need forcareful consideration of lipemia interferences in clinical laboratories. These findings highlight the importance of tailored interference studies using natural lipemic samples to enhance result accura- cy and ensure effective patient care. Authorship contributions E S: wrote the manuscript, designed the study, performed the sample collection and analysis, performed the statistical analysis, critically revised the manuscript. DY: designed the study, critically revised the manuscript.M : designed thestudy, performed the sample collection and analy Published by: Longman Publishers www.jst.org.in
formed the sample collection and analysis, critical- ly revised the manuscript. S Bolat: performed the statistical analysis, critically revised the manu- script. All authors have accepted responsibility for the entire content of the submitted manuscript and approved submission. Potential conflict of interest The part of the study related to the coagulation parameters was presented as an oral presentation at the 32nd National Biochemistry Congress orga- nized by the Turkish Biochemical Society on Octo- ber 27- 30, 2021. Data availability statement All data is given in the manuscript and supplemen- tal materials. References 1.Clinical and Laboratory Standards Institute (CLSI). Interfe- rence testing in clinical chemistry. 2nd ed. CLSI document EP7-A2. Wayne:CLSI;2005. 2.Nikolac N. Lipemia: Causes, interference mechanisms, detection and management. Biochem Med (Zagreb). 2014;24:57-67. https://doi.org/10.11613/BM.2014.008 3.Calmarza P, Cordero J. Lipemia interferences in routine clini- cal biochemical tests. Biochem Med (Zagreb). 2011;21:160- 6. https://doi.org/10.11613/BM.2011.025 4.Kroll MH, McCudden CR. Endogenous interferences in clinical laboratory tests: Icteric, lipemic and turbid samples: Walter de Gruyter;2012. https://doi.org/10.1515/9783110266221 5.Simundic AM, Nikolac N, Guder WG. Preanalytical variati- on and preexamination processes. In: Rifai Nader, eds. Tietz textbook of clinical chemistry and molecular diagnostics. 6th ed. Saunders;2017.p.81-119. 6.Garvey WT, Kwon S, Zheng D, Shaughnessy S, Wallace P, Hutto A et al. Effects of insulin resistance and type 2 dia- betes on lipoprotein subclass particle size and concentra- tion determined by nuclear magnetic resonance. Diabetes. 2003;52:453-62. https://doi.org/10.2337/diabetes.52.2.453 7.Nikolac N, Simundic AM, Miksa M, Lima-Oliveira G, Salva- gno GL, Caruso B et al. Heterogeneity of manufacturers declarations for lipemia interference - an urgent call for standardization. Clin Chim Acta. 2013;426:33-40. https:// doi.org/10.1016/j.cca.2013.08.015 8.Kroll MH. Evaluating interference caused by lipemia. Clin Chem. 2004;50:1968-9. https://doi.org/10.1373/ clinchem.2004.038075 9.Glick MR, Ryder KW, Jackson SA. Graphical compari- sons of interferences in clinical chemistry instrumenta- tion. Clin Chem. 1986;32:470-5. https://doi.org/10.1093/ clinchem/32.3.470 10.Oliclinomel n7-1000 e nf zyonluk elektrolitli amino asit zeltisi, glukoz zeltisi,lipid em lsiyonu (%20). Available from: https://www.google.com/search?q=packaging+met Hc71DhAQBSgAegQIARAx&biw=1396&bih=657. Accessed April 26th 2021. 11.Nanji AA, Poon R, Hinberg I. Lipaemic interference: Effects of lipaemic serum and intralipid. J Clin Pathol. 1988;41:1026-7. https://doi.org/10.1136/jcp.41.9.1026 12.Bornhorst JA, Roberts RF, Roberts WL. Assay-specific diffe- rences in lipemic interference in native and intralipid- supplemented samples. Clin Chem. 2004;50:2197-201. https://doi.org/10.1373/clinchem.2004.040154 13.Zeng SG, Zeng TT, Jiang H, Wang LL, Tang SQ, Sun YM et al. A simple, fast correction method of triglyceride interference in blood hemoglobin automated measurement. J Clin Lab Anal. 2013;27:341-5. https://doi.org/10.1002/jcla.21568 14.Zheng YZ, Pearce RW, McShane AJ. Lipemia interferen- ce for alt and ast: Effect from native lipid and commerci- al lipid emulsion-supplemented samples. J Appl Lab Med. 2020;5:817-9. https://doi.org/10.1093/jalm/jfaa025 15.Hunsaker JJH, Wyness SP, Needham LL, Genzen JR. Eva- luation of l-index interference limits on Roche Cobas c502 and c702 immunoturbidimetric assays using endogenou- sly lipemic specimens and intralipid spiking. Clinical Bio- chemistry. 2019;70:18- 23. https://doi.org/10.1016/j.clinbio- chem.2019.05.014 16.Koch CD, Vera MA, Messina J, Price N, Durant TJS, El-Khoury JM. Preventing pseudohyponatremia: Intralipid-based lipe- mia cutoffs for sodium are inappropriate. Clin Chim Acta. 2021;520:63-6. https://doi.org/10.1016/j.cca.2021.05.032 17. ene M, Alpdemir M, K rt l G, E, olak Samsum E, Alpdemir MF. Effects of lipemia on capillary serum prote- in electrophoresis in native ultra-lipemic material and in- travenous lipid emulsion added sera. Clin Chem Lab Med. 2023;61:1054-64. https://doi.org/10.1515/cclm-2022-0955 18.Turhan G, Kayalp D, Senes M, Yucel D. Effects of lipemia on osmolality in native lipemic material and intravenous lipid emulsion added sera. Clin Chem Lab Med. 2015;53:e59-61. https://doi.org/10.1515/cclm-2014-0760 19.Clinical and Laboratory Standards Institute (CLSI). Hemo- lysis, icterus, and lipemia/turbidity indices as indicators of interference in clinical laboratory analysis. CLSI document C56-A. Wayne:CLSI;2012. hod&spell=1&sa=X&ved=2ahUKEwiFvfPDupvwAhW6hP0H
20. 21. comparison with conventional coagulation tests. Scand J Clin Lab Invest. 2017;77:98-103. https://doi.org/10.1080/00 365513.2016.1271906 22.Florin L, Oyaert M, Van Maerken T, Devreese KMJ. Perfor- mance of the preanalytical check module of the stago sta r max2 mechanical endpoint detection analyzer for asse- ssing the impact of hemolysis, lipemia, and icterus on aptt and pt. Int J Lab Hematol. 2018;40:e109-e12. https://doi. org/10.1111/ijlh.12871 23.Mitropoulos KA, Reeves BE, Miller GJ. The activation of fac- tor vii in citrated plasma by charged long-chain saturated fatty acids at the interface of large triglyceride-rich lipopro- teins. Blood Coagul Fibrinolysis. 1993;4:943-51. https://doi. org/10.1097/00001721-199304060-00012 24.Mitropoulos KA, Reeves BEA, O Brien DP, Cooper JA, Mar- tin JC. The relationship between factor vii coagulant ac- tivity and factor xii activation induced in plasma by en- dogenous or exogenously added contact surface. Blo- od Coagulation & Fibrinolysis. 1993;4:223-34. https://doi. org/10.1097/00001721-199304000-00003 25.Agarwal S, Vargas G, Nordstrom C, Tam E, Buffone GJ, De- varaj S. Effect of interference from hemolysis, icterus and li- pemia on routine pediatric clinical chemistry assays. Clin Chim Acta. 2015;438:241-5. https://doi.org/10.1016/j. cca.2014.08.008 26.Jensen AK, Christensen GL, Dalgard A, Jorgensen NR. Esti- mation of lipemia interference with automated hil-test on d-dimer acl top 50 series analysis - reveals a higher cut-off than manufacturer s recommendations. Scand J Clin Lab In- vest. 2020;80:168-71. https://doi.org/10.1080/00365513.20 19.1703214 27.Montaruli B, Guiotto C, Cosseddu D. Influence of hemo- lysis, icterus, and lipemia on coagulation tests as per- formed on cobas t511 new analyzer. Blood Coagul Fi- brinolysis. 2020;31:48-54. https://doi.org/10.1097/ MBC.0000000000000873 28.Wu J, Ju HX. 3.07 - clinical immunoassays and immuno- sensing. In: Pawliszyn J, eds. Comprehensive sampling and sample preparation. Oxford: Academic Press; 2012.p.143- 67. https://doi.org/10.1016/B978-0-12-381373-2.00071-5 29.Ji JZ, Meng QH. Evaluation of the interference of hemoglo- bin, bilirubin, and lipids on roche cobas 6000 assays. Clin Chim Acta. 2011;412:1550-3. https://doi.org/10.1016/j. cca.2011.04.034 30.Ali D, Sacchetto E, Reigner A, Le Carrer D, Orsonneau JL, Delaroche O et al. [Lipemia and bilirubin influences for twenty-four biochemical parameters measurement]. Ann Biol Clin (Paris). 2015;73:671-89. https://doi.org/10.1684/ abc.2015.1088 31.Topkaya BC, Yucel D, Senes M, Canatan H, Saydam G. Effects of lipemia on routine biochemical analyses. Turk J Biochem. 1997;2:5- 15. 32.Soleimani N, Mohammadzadeh S, Asadian F. Lipemia in- terferences in biochemical tests, investigating the efficacy of different removal methods in comparison with ultracen- trifugation as the gold standard. J Anal Methods Chem. 2020;2020:9857636. https://doi.org/10.1155/2020/9857636 33.Saracevic A, Nikolac N, Simundic AM. The evaluation and comparison of consecutive high-speed centrifugati- on and lipoclear(r) reagent for lipemia removal. Clin Bio- chem. 2014;47:309-14. https://doi.org/10.1016/j.clinbio- chem.2014.01.001 Published by: Longman Publishers www.jst.org.in


