Overview of LT Foods: Market Performance, Business Operations, and Future Potential
LT Foods, a prominent player in the packaged rice processing and export industry, boasts a strong brand portfolio including Daawat. With a focus on branded sales growth, reduction of debt, and product diversification, LT Foods is strategically positioning itself for future success. Recent developments such as a successful fund raise and partnerships highlight the company's commitment to expansion and innovation. With a solid financial track record and key growth drivers in place, LT Foods is poised for continued success in the market.
Download Presentation

Please find below an Image/Link to download the presentation.
The content on the website is provided AS IS for your information and personal use only. It may not be sold, licensed, or shared on other websites without obtaining consent from the author.If you encounter any issues during the download, it is possible that the publisher has removed the file from their server.
You are allowed to download the files provided on this website for personal or commercial use, subject to the condition that they are used lawfully. All files are the property of their respective owners.
The content on the website is provided AS IS for your information and personal use only. It may not be sold, licensed, or shared on other websites without obtaining consent from the author.
E N D
Presentation Transcript
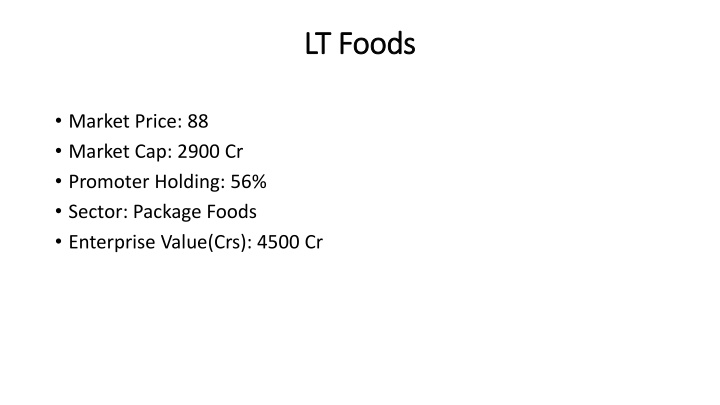
LT Foods LT Foods Market Price: 88 Market Cap: 2900 Cr Promoter Holding: 56% Sector: Package Foods Enterprise Value(Crs): 4500 Cr
Introduction of LT Foods Introduction of LT Foods LFL is one of the country s leading companies in the processing and export of packaged rice. The company s flagship brand is Daawat . LFL is among the top players in the domestic branded Basmati markets. It primarily offers Basmati under the Daawat , Heritage and Orange brand names. The company's brand portfolio includes Daawat Traditional Basmati Rice , Daawat Biryani Basmati Rice , Daawat Pulav Basmati Rice , Daawat Super Basmati Rice and Daawat Rozana . The product portfolio includes brown rice, white rice, steamed rice, parboiled rice and organic rice. The company also engages in trading of merchandise. LFL, with its subsidiary companies, is embarking on new food products such as fast cooking brown rice, rice cakes, rice chips and several rice-based snacks. The company s has five manufacturing facilities located in the states of Punjab, Madhya Pradesh and Haryana. It exports to more than 50 countries including the US, Canada, the UK, Europe, the Middle East, and Africa.
Profit and Loss Statement Profit and Loss Statement Narration Mar-13 Mar-14 Mar-15 Mar-16 Mar-17 Trailing Sales 2,207.68 2,474.11 2,734.58 2,973.42 3,286.55 3,518.11 Expenses 1,991.56 2,210.84 2,470.85 2,660.82 2,918.72 3,135.43 Operating Profit 216.12 263.27 263.73 312.60 367.83 382.68 Other Income 22.63 18.62 45.20 6.26 33.96 34.58 Depreciation 38.84 37.40 46.57 51.52 54.16 45.47 Interest 117.13 113.42 151.15 147.80 154.55 144.14 Profit before tax 82.78 131.06 111.22 119.55 193.08 227.64 Tax 22.70 46.26 34.80 47.08 64.40 79.79 Net profit 56.05 78.33 72.49 72.11 117.43 141.25 EPS 2.14 2.98 2.74 2.70 4.40 4.42
Resent Development Company has raised 400 cr Via at price of 78.65 per share DSP Blackrock , SBI MF and Reliance MF bought un this QIP 150-200 cr will be used to reduse Debt and and rest of this is use for working capital.
Trigger to Watch out Trigger to Watch out Company branded sales can grow as its only 56% of sales as on Fy 2017 Which margin is high. While its peer KRBL has at 85% sales in Branded Rise. Now company is Focus on Branded Sale So Its chance to Improve 11% to at least 15%. After QIP money they reduce debt so financial cost can do down and deleverage of balance Sheet. Company has install plant in USA for Value added Product that will contribute in Future ( Ready to Eat Rice) Company also Focus on working capital days, In 2011 its 263 days its come down to 178 days. As per Concall Q3 Company says there is no more Capex for at least 5 years. Now Focus on Cash generation activities.
Growth Drivers Growth Drivers India will became growth driver its go to unorganized to organized US Market: Ready to Eat, Acceptable of Daawat Rice. LTFL entered into a JV with Kameda Seika (leading Japanese snack company) to manufacture rice-based snacks.
LT Foods- 1920 Cr Year Price/Earnings Price/Book Price/CashFlow Price/Sales EV/EBITDA Dividend Yield Sales EBDIT % EBDIT cash convetion days ROE ROCE Mar-08 4.12 0.91 -0.82 0.19 8.21 2.47% 695.07 84.77 12.19589 12.56586 11.99757 9.406388 9.946826 10.8145202 11.39319 11.29753 10.72401 12.22528 216.52 203.69 260.2 263.32 261.36 22% 17% 11% 9% 0% 9% 11% 6% 6% 6% Mar-09 Mar-10 Mar-11 Mar-12 2.30 6.41 0.39 0.71 5.18 -10.14 0.07 0.16 5.92 7.76 3.21% 2.69% 1,060.97 1,052.88 133.32 126.32 Mar-13 2.37 0.43 Mar-14 3.56 0.71 2.69 0.11 6.19 2.13% 2,474.11 281.88 Mar-15 4.43 0.69 35.72 0.12 6.45 1.65% 2,734.58 308.94 Mar-16 8.46 1.14 2.05 0.21 6.82 0.00% 2,973.42 318.87 Mar-17 14.86 2.66 8.03 0.53 8.25 0.00% 3,286.55 401.79 6.05 0.54 -1.25 0.11 10.35 2.21% 1,260.42 118.56 -86.06 0.41 1.11 0.07 8.99 0.00% 1,421.76 141.42 0.06 6.32 3.93% 2,207.68 238.75 188.98 18% 205.33 20% 10% 205.69 16% 188.69 13% 10% 178 18% 11% 9% 9% KRBL-14500 Cr Year Price/Earnings Price/Book Price/CashFlow Price/Sales EV/EBITDA Dividend Yield Sales EBDIT % EBDIT cash convetion days ROE ROEC Mar-08 5.90 0.90 -1.51 0.32 6.77 1.76% 996.53 143.59 15.56% 248.43 Mar-09 Mar-10 Mar-11 Mar-12 3.09 5.95 0.36 1.27 0.51 3.72 0.11 0.40 3.80 6.09 3.39% 1.15% 1,245.46 1,579.01 180.47 197.91 15.02% 12.82% 226.16 182.89 12% 21% 13% 14% Mar-13 3.78 0.71 3.35 0.27 4.29 3.35% 2,080.34 294.98 16.00% 236.26 Mar-14 4.94 1.29 -6.20 0.47 5.59 2.14% 2,791.31 408.36 16.85% 198.03 Mar-15 14.81 3.30 12.83 1.34 11.31 0.96% 3,113.01 483.39 15.64% 218.57 Mar-16 15.40 3.45 11.67 1.51 11.42 0.89% 3,347.90 450.09 16.20% 207.36 Mar-17 24.76 5.31 37.36 3.15 16.81 0.00% 3,147.87 649.38 20.82% 217.54 6.69 1.27 -5.23 0.50 7.05 0.94% 1,544.59 226.2 15.33% 241.98 6.81 0.72 3.44 0.30 6.71 1.50% 1,631.00 230.2 12.86% 285.37 15% 10% 19% 10% 11% 10% 19% 12% 26% 12% 22% 14% 22% 12% 21% 15%
Valuation Valuation As CMP of 90 rupees its PE is around 20-its reasonable as see no more capex in near term its now cash flow generation activates and Deleverage of balance sheet. Price to Sales is around 0.80 while KRBL is around 5 which is scope. For next 3 year 4500 cr sales and 675 cr EBDIT and PAT is around 225cr.So LT Food can deliver 20% CAGR For next 3-4 Years.
Risks Risks Volatility in raw material prices: The basmati rice processing industry is an agro based industry and its main raw material is basmati paddy. More variable to affect like Monsoon , Ban in Iran or china etc.. Currency Risk.
Sources Sources https://www.nseindia.com/content/corporate/eq_DAAWAT_base.pdf Motilal Oswal Research Report Concall of company Valuepickr Forum
Thank You -Amit Darji Email ID: amitdarji2640@gmail.com Mobile Number: 90333 59609
