Overview of Local Authority Customer Service and Information Needs
This overview delves into the information needs and customer service requirements of various stakeholders, including residents, businesses, landlords, tenants, and more. It covers essential services, statutory duties, and financial performance measures to enhance transparency, decision-making, and accountability within local authorities.
Download Presentation

Please find below an Image/Link to download the presentation.
The content on the website is provided AS IS for your information and personal use only. It may not be sold, licensed, or shared on other websites without obtaining consent from the author. Download presentation by click this link. If you encounter any issues during the download, it is possible that the publisher has removed the file from their server.
E N D
Presentation Transcript
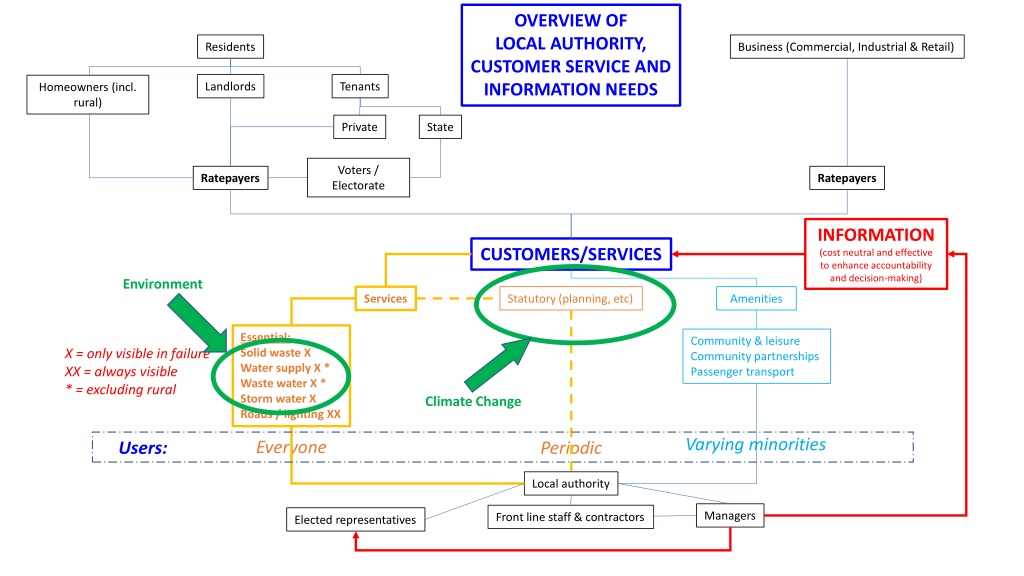
OVERVIEW OF LOCAL AUTHORITY, CUSTOMER SERVICE AND INFORMATION NEEDS Residents Business (Commercial, Industrial & Retail) Landlords Tenants Homeowners (incl. rural) Private State Voters / Electorate Ratepayers Ratepayers INFORMATION (cost neutral and effective to enhance accountability and decision-making) CUSTOMERS/SERVICES Environment Services Statutory (planning, etc) Amenities Essential: Solid waste X Water supply X * Waste water X * Storm water X Roads / lighting XX Community & leisure Community partnerships Passenger transport X = only visible in failure XX = always visible * = excluding rural Climate Change Varying minorities Everyone Users: Periodic Local authority Managers Front line staff & contractors Elected representatives
Standard Financial Performance Measures Template Working Draft, page 1 Page 1: COMPETITORS: Comparisons: household/RV* Wellington Lower Hutt National Peer Group BENCHMARKS: Local Government (Financial) Performance Measures based on y/e June 2018 Revenues/Income: Actual $000s Residential Rates (per household) Business (per $1m *Rating Valuation) Retail (per $1m *Rating Valuation) Rural (per unit) Sub Total General Rates Income Less: Rates subsidies/holidays Net Total General Rates Income Fees & Charges Development and Financial contributions Subsidies and grants Revenue from vested assets Total Income Expenditure: Actual $000s Employees Outsourced personnel Contracted personnel Sub Total Personnel Repairs & Maintenance Materials Interest paid Depreciation Other expenses (internal charges) Sub Total expenses this year Add expenses subsidies/grants Total expenses this year Surplus/(deficit) (KPI): Share/100 (%) Per household/RV* Share/100 (%) Per household Example: Annual Rates Charged, per $1,000,000 commercial property Porirua Business (per $1m RV *Rating Valuation) Source: 2016 PEDG Presentation to PCC (*Data provided by Chris Kirk-Burnnand) Tauranga Upper Hutt Wellington $15,950 $18,950 $4,800 $10,250
Standard Financial Performance Measures Template Working Draft, page 2 Page 2: COMPETITORS: BENCHMARKS: Local Government (Detailed expenses) Performance Measures based on y/e June 2018 Expenses performance measures: Actual $000s Essential Services (net cost**): Stormwater (cu.m.) Wastewater (cu.m.) Water Supply (cu.m.) Roading, lighting & pathways (kms) Solid Waste (tonnes) **Excluding Internal charges applied Statutory Duties (net cost**): Environment & Regulatory (?) Emergency Management (?) Economic Development (?) Democratic Process (?) **Excluding Internal charges applied Social Amenities (net cost**): Community & leisure (Population?) Community Partnerships (?) Passenger Transport (?) Social Housing (?) **Excluding Internal charges applied Total Internal charges applied Regional Contribution Total expenses (full accruals basis) Last Year Forecast/plan next year LTP year Comparisons Lower Hutt National Peer Group Share/100 (%) Per Measurement Unit Wellington
Standard Financial Performance Measures Template Working Draft, page 3 Page 3.1 OPEX including interest & depreciation: Local Government (Expert) Performance Measures based on y/e June 2018 Expert Performance Measures Actual $000s Stormwater: cost/cubic meters Wastewater: cost/cubic meters Supply Water: cost/cubic meters Solid Waste: cost/tonnes? Transport (Roading): cost/km COMPETITORS: BENCHMARKS: Comparisons Lower Hutt National Peer Group Share/100 (%) Per Measurement Unit Wellington Page 3.2 CAPEX versus Depreciation: Local Government (asset renewal) Performance Measures based on y/e June 2018 Renewal Capital vs Depreciation Actual $000s Essential Services CAPEX: Stormwater (excluding growth) Wastewater (excluding growth) Supply Water (excluding growth) Transport (excluding growth) Solid Waste (excluding growth) Social Amenities CAPEX: Community Infrastructure (excel growth) Parks (excel growth) COMPETITORS: BENCHMARKS: Variation Comparisons Lower Hutt National Peer Group Depreciation Variance - +/- Wellington Local Government (growth requirements) based on y/e June 2018 Page 3.3 Growth-related CAPEX: Growth/Dev. Contributions: Growth CAPEX Net Growth CAPEX surplus/(deficit) Variation Comparisons Lower Hutt National Peer Group Actual $000s Last Year Plan Wellington Page 3.4 Ratepayer Funds Exposed to Private Sector Initiatives/risks: Disclosure of past, current and proposed Funding, including CAPEX and OPEX Commentary to include comprehensive risk analysis of actual, ongoing and proposed financial grants and/or guarantees: With detailed supplementary attachments as necessary to enable ratepayers and their elected reprsentatives to judge costs and risks Actual $000s Last Year Cumulative Wellington Lower Hutt National Peer Group
Non-Financial Performance Measures Template Working Draft, page 4 Page 4: COMPETITORS: Comparisons (actual current year) Wellington Lower Hutt National Peer Group BENCHMARKS: Non-Financial Performance Measures (per 2013 rules) (number of reports/measure) Water Supply: Actual year Safety (2) Water loss (reticulation maintenance, 1) Fault response times (4) Customer satisfaction (6) Demand management (1) Sewage treatment & disposal: Overflows/1000 connections (1) Discharge compliance (4) Fault response times (2) Customer satisfaction (4) Stormwater: Flood events (2) Discharge compliance (4) Response times (1) Customer satisfaction (1) Major protection & control works (1): Solid waste: Kerbside measures (3) Recycling (1) Waste volume/tonnes (1) Roads & footpaths: Safety (1) Road conditions (1) Road Maintenance (1) Footpaths (1) Response to requests (1) Commentary: Plan Target Last year
