Optimization of Bioethanol Production from Cassava Peels Using Microbial Inoculants
This study focuses on optimizing bioethanol production from cassava peels of different cassava varieties using various microbial inoculants. Cassava, a widely cultivated food crop in tropical regions, provides an attractive source for bioethanol production due to its high yield and ease of cultivation. The research aims to enhance bioethanol production efficiency through simultaneous saccharification and fermentation processes. Different inoculants such as Aspergillus niger, Saccharomyces cerevisiae, Rhizopus nigricans, and Spirogyra africana were tested to determine their impact on ethanol yield. The methodology involved processing cassava peels from selected cultivars, culturing them under anaerobic conditions with varying pH levels, and monitoring ethanol production over time. Results were obtained through optical density measurements and trial fermentations to identify optimal parameters for maximum ethanol yields.
Download Presentation

Please find below an Image/Link to download the presentation.
The content on the website is provided AS IS for your information and personal use only. It may not be sold, licensed, or shared on other websites without obtaining consent from the author.If you encounter any issues during the download, it is possible that the publisher has removed the file from their server.
You are allowed to download the files provided on this website for personal or commercial use, subject to the condition that they are used lawfully. All files are the property of their respective owners.
The content on the website is provided AS IS for your information and personal use only. It may not be sold, licensed, or shared on other websites without obtaining consent from the author.
E N D
Presentation Transcript
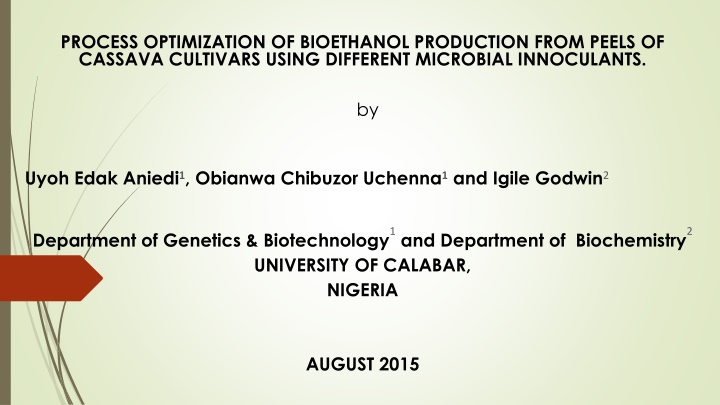
PROCESS OPTIMIZATION OF BIOETHANOL PRODUCTION FROM PEELS OF CASSAVA CULTIVARS USING DIFFERENT MICROBIAL INNOCULANTS. by Uyoh Edak Aniedi1, Obianwa Chibuzor Uchenna1and Igile Godwin2 1and Department of Biochemistry UNIVERSITY OF CALABAR, NIGERIA 2 Department of Genetics & Biotechnology AUGUST 2015
CASSAVA IS CULTIVATED EXTENSIVELY AS A FOOD CROP IN NIGERIA AND OTHER TROPICAL REGIONS PROCESSED INTO TAPIOCA, GARRI, FUFU AND CASSAVA FLOUR 3RD LARGEST SOURCE OF CARBOHYDRATE IN THE WORLD THERE S A GROWING CONVERSION OF ORGANIC WASTES LIKE CASSAVA PEELS INTO USEFUL BIOETHANOL. INTEREST IN THE END-PRODUCTS LIKE
ATTRACTIVE FEATURES OF CASSAVA: high yielding able to grow on marginal soils requires minimal labour and mangt costs Thus, good candidate for bioethanol prod
AIM OF STUDY - TO OPTIMIZE THE PRODUCTION OF BIOETHANOL USING DIFFERENT MICROBIAL INOCULANTS FOR THE SIMULTANEOUS SACCHARIFICATION AND FERMENTATION OF CASSAVA PEELS IN 3 CASSAVA VARIETIES .
INNOCULANTS USED Aspergillus niger + Saccharomyces cerevisiae Aspergillus niger + Saccharomyces cerevisiae + Rhizopus nigricans Spirogyra africana + Saccharomyces cerevisiae + Rhizopus nigricans Aspergillus niger + Saccharomyces cerevisiae + Spirogyra africana Rhizopus nigricans + Saccharomyces cerevisiae
METHODOLOGY : Peels from 3 cassava cultivars TME 0505, TME 419, and TME 4779, were washed, dried in an oven at 120oC for 3hours, ground into a fine texture using a locally made milling machine & sieved with 1.5 nylon sieve. Cultured under anaerobic condition at different pH in small bioreactors using the five inoculants separately.
Optical Density (microbial growth) was measured using a spectrophotometer every 3 days. Trial fermentation was done to find out the optimal parameters required for high ethanol yields Amount of Ethanol produced was recorded at 7, 14 & 21 days using optimal parameters
TABLE 1 Optical densities (indicating microbial growth) for different inoculum at 540nm and the observed pH (in brackets) in cassava cultivar TME 0505 Inoculum Day 0 Day 3 Day 6 Day 9 Day 12 Day 15 Day 18 Day 21 Rhizopus/yeast 1.131 (5) 1.22 (4) 1.339 (4) 1.485 (5) 1.33 (5) 1.22 (5) 1.064 (5) 0.94 (5) Aspergillus/yeast 0.915 (6) 1.272 (6) 1.535 (5) 1.383 (5) 1.262 (5) 1.255 (5) 1.011 (5) 0.901 (6) Aspergillus/ Rhizopus/yeast 1.12 (5) 1.34 (5) 1.401 (5) 1.471 (5) 1.125 (5) 0.95 (6) 1.001 (6) 0.997 (6) Rhizopus/Spirogyra/ye ast 0.804 (5) 0.914 (5) 1.42 (5) 1.608 (5) 1.632 (5) 1.35 (6) 1.226 (6) 0.928 (6) Aspergillus/ Spirogyra/ yeast 0.929 (5) 1.056 (5) 1.614 (5) 1.61 (5) 1.456 (5) 1.232 (6) 1.325 (6) 1.05 (6)
O.D 1.8 1.632 1.6 1.614 1.608 1.61 1.535 1.485 1.471 1.456 1.4 1.401 1.42 1.383 1.35 1.34 1.339 1.33 1.262 1.325 1.272 1.255 1.22 1.232 1.226 1.2 1.22 1.131 1.12 1.125 1.064 1.011 1.001 1.056 1.05 1 0.997 0.928 0.95 0.94 0.901 0.915 0.929 0.914 0.8 0.804 0.6 0.4 0.2 0 Day 0 Day 3 Day 6 Day 9 Day 12 Day 15 Day 18 Day 21 Rhizopus/yeast Rhizopus/Spirogyra/yeast Aspergillus/yeast Aspergillus/ Spirogyra/ yeast Aspergillus/ Rhizopus/yeast FIG. 1: Growth curve obtained from treating cassava cultivar TME 0505 with different innocula
TABLE 2 Microbial growth from different inoculants at optical density of 540nm and the observed pH, in cultivar TME 419 TME 419 Inoculum Day 0 Day 3 Day 6 Day 9 Day 12 Day 15 Day 18 Day 21 Rhizopus/yeast 1.03 (5) 1.362 (4) 1.345 (5) 1.551 (5) 1.194 (5) 1.23 (6) 0.992 (6) 1.011 (6) Aspergillus/yeast 0.94 (5) 0.997 (4) 1.349 (5) 1.245 (5) 1.139 (5) 1.147 (5) 1.202 (6) 1.101 (6) Aspergillus/ Rhizopus/yeast 0.983 (5) 1.008 (5) 1.42 (5) 1.22 (5) 1.036 (5) 0.995 (6) 1.002 (6) 0.922 (6) Rhizopus/Spirogyra/yeast 0.801 (6) 1.294 (5) 1.643 (5) 1.62 (5) 1.52 (6) 1.41 (6) 1.229 (6) 1.16 (8) Aspergillus/ Spirogyra/ yeast 0.903 (5) 1.087 (5) 1.639 (5) 1.598 (5) 1.401 (6) 1.4 (6) 1.34 (6) 1.2 (8)
O.D 1.8 1.643 1.639 1.62 1.598 1.6 1.551 1.52 1.42 1.4 1.41 1.4 1.401 1.362 1.345 1.349 1.34 1.294 1.245 1.22 1.23 1.229 1.2 1.202 1.2 1.194 1.139 1.16 1.147 1.101 1.087 1.036 1.03 0.983 1 1.011 0.997 1.008 0.992 1.002 0.995 0.94 0.903 0.922 0.8 0.801 0.6 0.4 0.2 0 Day 0 Day 3 Day 6 Day 9 Day 12 Day 15 Day 18 Day 21 Rhizopus/yeast Rhizopus/Spirogyra/yeast Aspergillus/yeast Aspergillus/ Spirogyra/ yeast Aspergillus/ Rhizopus/yeast FIG. 2: Growth curve obtained from treating cassava cultivar TME 419 with different inoculants
TABLE 3 Microbial growth for different inoculum at optical density of 540nm and the observed pH, on cassava cultivar TME 4779 TME 4779 Inoculum Day 0 Day 3 Day 6 Day 9 Day 12 Day 15 Day 18 Day 21 Rhizopus/yeast 0.929 (4) 1.376 (5) 1.629 (5) 1.648 (5) 1.243 (5) 1.012 (5) 1.002 (5) 0.957 (5) Aspergillus/yeast 1.036 (5) 1.245 (5) 1.432 (5) 1.307 (4) 1.14 (5) 1.125 (5) 1.011 (6) 0.942 (5) Aspergillus/ Rhizopus/yeast 1.075 (5) 1.471 (5) 1.587 (5) 1.553 (5) 1.229 (5) 1.156 (6) 1.114 (6) 1.116 (6) Rhizopus/Spirogyra/yeast 1.049 (5) 1.061 (5) 1.634 (5) 1.413 (5) 1.476 (6) 1.321 (6) 1.225 (6) 1.164 (8) Aspergillus/ Spirogyra/ yeast 1.096 (5) 1.115 (5) 1.628 (5) 1.48 (6) 1.296 (6) 1.305 (6) 1.312 (6) 1.126 (8)
O.D 1.8 1.648 1.634 1.628 1.629 1.587 1.6 1.553 1.48 1.476 1.471 1.432 1.4 1.413 1.376 1.321 1.305 1.312 1.307 1.296 1.245 1.243 1.229 1.225 1.2 1.164 1.156 1.14 1.116 1.126 1.125 1.115 1.114 1.075 1.096 1.061 1.036 1.049 1 1.012 1.002 1.011 0.957 0.942 0.929 0.8 0.6 0.4 0.2 0 Day 0 Day 3 Day 6 Day 9 Day 12 Day 15 Day 18 Day 21 Rhizopus/yeast Aspergillus/yeast Aspergillus/ Rhizopus/yeast Rhizopus/Spirogyra/yeast Aspergillus/ Spirogyra/ yeast FIG. 3: Growth curve obtained from treating cassava cultivar TME 4779 with different inoculants
RESULTS OF FERMENTATION AT OPTIMIZED PARAMETERS pH 5.0, temperature 28oC, increased surface area of substrate, substrate concentration and concentration on Days 7, 14 and 21 are shown in tables 5, 6 and 7. inoculant culture
TABLE 5 Ethanol yield obtained on the 7th day from three cassava cultivars treated with the different inoculants TME 0505 TME 419 TME 4779 inoculum vol (ml) mass (g/cm) vol (ml) mass (g/cm) vol (ml) mass (g/cm) 13.33b 1.33 10.71b 1.07 13.33b 0.88 10.71b 0.71 17.33b 2.94 13.92b 1.88 A 13b 0.58 10.44b 0.47 15.33 b 0.34 12.32 b 0.27 16.00 b 1.00 12.86 b 0.80 B 13.33 b 0.34 10.71 b 0.27 14.66 b 0.88 11.78 b 0.71 16.00 b 0.00 12.85 b 0 C 18a 1.00 14.46 a 0.80 18.33 a 2.03 14.73 a 1.63 23.67 a 0.67 19.01 a 0.53 D 17.33 a 0.88 13.92 a 0.71 18 a 0.58 14.46 a 0.47 21.33 a 0.33 17.14 a 0.26 E 8.67c 1.20 6.96 c 0.97 8.67 c 1.46 6.96 c 1.17 11 c 1.00 8.84 c 0.80 Control
TABLE 6 Ethanol yield obtained on the 14th day from three cassava cultivars treated with different inoculants TME 0505 TME 419 TME 4779 inoculum vol (ml) mass (g/cm) vol (ml) mass (g/cm) vol (ml) mass (g/cm) 12.33b 0.88 9.91 b 0.70 13.67 b 0.88 10.98b 0.71 17 b 3.22 13.66 b 2.58 A 17.67b 1.20 14.19b 0.97 17b 1.53 13.67 b 1.23 16 b 1.00 12.86b 0.80 B 13.67b 1.20 10.97b 0.97 12.67b 0.34 10.17b 0.27 14b 2.33 11.24b 1.61 C 15.67b 1.86 12.49b 1.46 14.46b 1.77 11.78b 1.42 21.33 b 0.88 17.14 b 1.87 D 19.57a 1.33 15.8a 1.07 19a 1.16 15.26a 0.93 22.33a 0.88 17.94a 0.70 E 6.67c 0.88 5.89c 0.97 7c 0.58 5.62c 0.81 9.33c 2.60 9.34c 1.17 Control
TABLE 7 Ethanol yield obtained on the 21st day from three cassava cultivars treated with different inoculants TME 0505 TME 419 TME 4779 inoculum vol (ml) mass (g/cm) vol (ml) mass (g/cm) vol (ml) mass (g/cm) 10.66b 0.34 8.57b 0.27 11.67b 1.20 9.37b 0.96 15.33b 2.33 12.32b 1.88 A 14b 0.58 11.25b 0.47 15.33b 1.86 12.31b 1.49 13b 1.00 10.45b 0.80 B 11b 0.58 8.84b 0.47 11.33b 0.33 9.11b 0.27 11b 0.58 9.37b 0.96 C 17a 1.53 13.66a 1.22 15.67a 1.67 12.59a 1.34 22a 1.73 17.67a 1.39 D 21a 1.53 16.87a 1.22 21.33a 0.66 17.14a 0.53 21.33a 0.34 17.14a 0.27 E 9.67c 0.67 7.77c 0.54 7.67c 0.88 6.16c 0.71 10c 1.00 8.03c 0.80 Control
TABLE 8 Proximate Analysis of Cassava Cultivars Parameter Tested TME 4779 TME 419 TME 0505 Moisture Content (%) 62.19 63.59 64.15 Dry Matter (%) 34.92 30.72 25.77 Starch (%) 72.19 70.44 69.85 Fibre (%) 3.42 3.22 3.12 Ash (%) 0.45 0.47 0.28 Protein (%) 2.25 1.15 1.26 Fat (%) 0.61 0.72 0.78 Carbon Nitrogen Phosphorus(ppm) 12.27 6.29 8.56
DISCUSSION The yield reported in this study competes favorably with (and sometimes better than) those reported from cassava peels using other inoculants, potato peels and spoilt mangoes by other workers. Growth curves obtained using the five treatments differed slightly, reflecting differences in the enzymatic composition of these microorganisms and in the composition of peels of the three cassava varieties.
An optimum pH of 5.0 obtained in this study is the pH at which each curve showed maximum activity. Cassava cultivar 4779 when treated with Rhizopus nigricans, Spirogyra africana and Saccharomyces cereviceae gave the highest yield of 19.01g/cm3 and percentage concentration yield of 22% on the 7th day. This may be attributed to the presence of Spirogyra as an additional carbon source for the microorganisms.
Spirogyra generally is known to be autotrophic and composition can also lead to increase in the release of sugars for fermentation. This result is in line with the work of Sulfahri et al., (2011) but gave a higher yield in the presence of cassava peel substrate and good pH conditions. its carbohydrate
Ethanol yield obtained in the present study is much lower than the 67.7% and 63.8% reported by Oyeleke and Jubril 2009 when Aspergillus niger and Zymomonas mobilis simultaneously on guinea corn husk and millet husk respectively. were used In line with reports that Saccharomyces cerevisiae is a non- amylolytic microorganism unable to hydrolyse strarch ( Jumai et al., 2006), low concentrations of ethanol were obtained in this study.
TME 4779 has the highest % starch composition of 72.19, Carbon-Nitrogen- Phosphorus (ppm) of 12.27 and dry matter of 34.92%; this may have contributed to the higher ethanol yield from it. Also the low fibre and ash content of cassava cultivar TME 0505 made it susceptible to quick microbial breakdown.
CONCLUSION The process of bioethanol production can be optimized for increased ethanol yield at a reduced period of fermentation by improving the various parameters affecting the medium (pH, substrate surface area and concentration). Bioethanol production from Spirogyra holds a significant potential due to their low percentage of lignin and hemicellulose content compared to other ligno-cellulosic plants.
Spirogyra can be cultivated and proliferated more, as a major feedstock for biofuel production. Cassava cultivars can be developed with higher starch content and lower fibre values so that the wastes generated can have higher bioethanol potential.
. biotechnology plants for conversion of biomass (agricultural wastes) to useful products as this will provide wealth and employment. There is need to invest in large-scale . The use of agricultural wastes instead of staple foods for biofuel production will not infringe on available food supply. It will in addition reduce pollution arising from improper management of these wastes.
THANKS FOR YOUR ATTENTION
