Motion in Physics


At the end of this unit you should:
1. Be able to state the relationship between speed,
velocity and acceleration.
2. Be able to draw and interpret distance–time graphs.
3. Be able to draw and interpret velocity–time graphs.
4. Be able to calculate the speed, velocity and
acceleration of objects.
 
acceleration
distance
distance–time graph
rate of change
 
speed
time
velocity
velocity–time graph
LIGHTBULB QUESTION
 
If a car is travelling at a constant
speed and turns a corner (we assume
it has not lost speed as it turns), both
its velocity and acceleration change.
Since the direction of speed has
changed (say from east to north to
west as in illustration) the velocity has
changed. Since the velocity has
changed, so has the acceleration.
 
 
Speed:
The distance an object in one unit of time. It can also be
described as the rate of change of distance with respect to time.
Unit: metre per second (m/s).
 
 
Distance:
The length of space between two points. Unit: metre (m).
 
 
Time:
A universal unit of measurement through which we measure
events in the past, present and future. Unit: second (s)
 
 
Equipment: 
Three wind-up toys, a long, smooth surface and a
stopwatch.
 
Instructions: 
Calculate the average speed of three wind-up toys.


Investigation 10.02.01: To calculate the average speed of three
wind-up toys
 
 
1. How would you make sure this was a fair test?
All cars receive the same amount of wind-up. They
compete over the same terrain and length of track.


2. Write a report on your experiment.
Your report writing should contain the following:
Statement of the problem/investigation being carried
out; list of equipment; list of variables (independent and
dependent); brief description of the procedure carried
out; data collected (description and visually); limitations
of study (error reporting etc.); conclusions.
 
 
3. Which toy was the fastest? Can you explain why?
Consider examining the cars to determine what makes
the fastest one so fast; for example, is it wheel size, or the
length of the car, or the weight?
 
 
(a)
What is the formula for calculating distance?
Speed = Distance/Time.
 
(b) In what units are speed, distance and time measured?
Speed is measured in metres per second (m/s). Distance is
measured in metres (m). Time is measured in seconds (s).
 
(c) Would it be a fair test to run 10 m to calculate your average
speed for 100 m? Why/why not?
No, it would not be a fair test as you are accelerating in the first
10–20 m of any sprint.
 
 
(d) Calculate the speed of a person walking 100 m in 60 s.
1.67 m/s.
 
 
(e) Calculate the speed of a person running 200 m in 24 s.
8.3 m/s.
 
 
(f) How long does it take a car to travel 7 km at a speed of 14 m/s?
Don’t forget to convert 7 km into metres. 500 s or 8.3 min.
 
 
(g) How far will a person walk in 1 hour if they walk at a speed of
1.5 m/s?
Convert 1 hour into seconds (60 min x 60 s) = 3600 s x 1.5=  5400
m or 5.4 km.
 
 
(h) Calculate the speed of a car travelling 2 km in 45 seconds.
Don’t forget to convert to SI units. 44.44 m/s. If you want to
convert to km/h, multiply by 3 600 (converts seconds to hours)
and divide that answer by 1 000 (converts metres to km) = 159.98
km/h.
 
 
(i) Calculate the speed of a car travelling 10 km in 15 minutes.
Don’t forget to convert to S.I. 11.11 m/s.
 
 
(j) How long does it take a truck to travel 15 km if it has a speed of
80 km/h?
Don’t forget to convert to SI units. 675.1 s or 11.25 min.
 
 
(k) How far can a person get if they run at a speed of 8 m/s for 1 h
and 10 min?
Convert to SI units. 33 600 m or 33.6 km.
 
 
(l) Compare the speed of the cars in (h) and (i).
Car H is travelling approximately four times faster than car I.


Velocity:
Speed in a given direction. Unit: metre per second (m/s).


(a)
A person walks north for 190 m. They walk this distance in
24 seconds. What is their velocity?
7.92 m/s north.
 
(b) Calculate the velocity of a rollercoaster if it covers 40 m in
1.5 s.
26.67 m/s. (We do not have a direction to supply as the
information is not given.)
 
(c) Which is faster: this rollercoaster in part (b) or a car covering 1
km in 35 s? What is the speed of this car in km/h?
The rollercoaster travels at 26.67 m/s (as per previous
questions). The car travels at 28.57 m/s. So the car travels
faster.
 
28.57 m/s x 3600 = 102 857.14 m/h.
102 857.14 m/h/1000 = 
102.86 km/h.
 
(d) A car travels from Dublin to Galway – a distance of 210 km –
in 2 h and 5 min. What is the velocity of the car?
Convert to SI units. 28 m/s west.
LIGHTBULB QUESTION
 
Yes, as velocity changes with direction because it is a vector
quantity (it has a size and direction).
 
 
Acceleration:
The change in velocity over time, or the rate of change of
velocity with respect to time.
LIGHTBULB QUESTION
 
Speed is not the same as
velocity. Since speed does not
have a direction, we cannot
equate speed and
acceleration. We can only
equate velocity and
acceleration.
 
(a) Which of these three examples involves acceleration?
(i)
A car changing its velocity from 10 m/s to 14 m/s.
Car is accelerating as there is a change in velocity.
(ii) A car travelling at a constant velocity.
No acceleration, as no change in direction or velocity.
(iii) A car changing its velocity from 14 m/s to 10 m/s.
Change in velocity (slowing down), so there is a change in
acceleration.


(b) In 
Table 10.02.02
you will see a list of
animals and their top
speeds. These are not
the speeds of these
animals in nature.
These are the speeds of
the animals if they
were the size of a
human. Use the table
to answer these
questions.
 
(b) (i) Which
animal is the
fastest?
 
White-
throated
needletail.
 
 
(b) (ii) What
animal is the
slowest?
 
African bush
elephant.
 
 
(b) (iii) Explain, in your own words, why you think the mouse is as
fast as the cheetah according to the table?
 
The table lists the animals’ speed if they were all human-sized. So,
if they were the same size, a mouse would be as fast as a cheetah.
 
 
(b) (iv) Suggest one possible method for calculating the speed of
the animals in their natural habitat. State how you would ensure it
is a fair test.
 
An observer would have to monitor the animals in their habitat,
measure a set distance and time the animals when they run that
distance. For it to be a fair test, all animals must run the same
distance.
 
 
(c) A car starting from rest accelerates to 15 m/s in 4 s. What is the
acceleration of the car?
 
3.75 m/s
2
.
 
 
(d) A car is moving at 27 m/s when it slams on the breaks and
comes to a stop 1.2 s later. What is the acceleration of the car?
 
-22.5 m/s2. Note the minus symbol indicates negative
acceleration (deceleration).
 
 
Table 10.02.04 
shows the distance covered by a car starting
from rest to 20 s later.


(a) Represent the information in Table 10.02.04 in a graph.


(i) How far had the car travelled after 2 min?
120 m.


(ii) At what time did the car reach 60 m?
1 s.


(iii) What was the speed of the car at 8 s and 10 s? Explain your
answer.
At both 8 s and 10 s the speed of the car is 60 m/s. The car is
travelling at a constant velocity.


(iv) Give the time taken for the car to reach 800 m.
800 m/60 m/s = 13.33 s.


(v) Is the car accelerating? Justify your answer.
Since the car is not changing its velocity (speed) and there is
now mention of direction, we can say there is no acceleration.
 
 
Tracking a jogger around a field, a graph of their movement can
be seen in Fig. 10.02.07. Using this graph, answer these questions.


(i)  What is the velocity of the runner at 1 s?
4 m/s


(ii) What is the velocity of the runner at 11 s?
6 m/s


(iii) In your own words, describe the motion of the runner
between 0–10 s.
The runner is accelerating from rest to 8 m/s within 2 s. After
these two seconds the runner maintains this velocity for 8 s.


(iv) What do we call the motion of the runner between 2–10 s?
Constant velocity.


(v) Calculate the acceleration of the runner between 0 and 2 s.
4m/s
2


(vi) Calculate the acceleration of the runner between 10 and 12
s.
-2 m/s
2
. Note the minus symbol indicates negative acceleration
(deceleration).


(vii) What is the acceleration of the runner between 18 and 20 s?
-5 m/s
2
.
 
Analysing Distance–Time Graphs
 
Graph showing an object moving with constant velocity
 
Graph showing an object moving with constant velocity
towards its starting point
 
Analysing Distance–Time Graphs
 
Graph showing an object that is not moving (stationary)
 
Analysing Distance–Time Graphs
 
Some graphs, like the one in 
Fig. 10.02.11
, include all three
conditions. Tell the story of this graph.


From 0 to 4 s the object is moving at a constant speed.
Between 4 and 6 s the object does not move; it stops at 40
metres. From 6–10 s the object is moving at a constant speed
back towards the 0 metre mark (start line) (where the object
started).
 
Analysing Velocity–Time Graphs
 
Graph showing an object moving with constant acceleration
 
Graph showing an object moving with constant deceleration
 
Analysing Velocity–Time Graphs
 
Analysing Velocity–Time Graphs
 
You may see a graph with all of these three conditions
involved, like the one shown in 
Fig. 10.02.15
. Can you explain
the motion of the object?
 
 
From 0–4 s the object is moving at constant acceleration, i.e. the
object has accelerated for those four seconds. Between 4–6 s the
object is travelling at a constant velocity so it is not accelerating.
Between 6–10 s the object is slowing down (decelerating) at a
constant acceleration.
 
 
Copy and Complete
In this topic I learned about 
distance
, speed and time. I also
learned the difference between speed, 
velocity
 
and 
acceleration
.
Speed just gives us a value of how fast a car is going, whereas
velocity gives us the speed and the 
direction
. The unit of speed and
velocity is 
metre per second (m/s)
.  
Acceleration is the 
rate
 of
change
 of velocity. The unit of acceleration is the 
metre per second
squared (m/s
2
). 
An alternative word for negative acceleration is
deceleration
. A distance-time graph allows me to see how far an
object has travelled in a certain amount of 
time
.
A 
velocity-time
 graph tells me how 
fast
 an object is moving at a
certain point in time.


1. Define speed. What is the unit of speed?
The speed of an object is the distance it travels in a certain
amount of time, or the rate of change of distance with
respect to time. Unit: metre per second (m/s).
 
2. Define velocity. What is the unit of velocity?
Velocity is speed in a given direction.
Unit: metre per second (m/s).
 
3. Define acceleration. What is the unit of acceleration?
Acceleration is the change in velocity over time, or the rate
of change of velocity with respect to time. The unit of
acceleration is the metre per second squared m/s
2
(also represented as m/s/s).


4. A ball was dropped from a balcony in a sports hall. The
ball’s approximate velocity was measured each second as
it fell. The data collected during this experiment is given in
the graph (
Fig 10.02.16
).


4. (i) What was the velocity of the ball after 3 s?
12 m/s
4. (ii) How long did it take the ball to reach a velocity of 15
m/s?
~3.9 s.
 
4. (iii) What was the acceleration of the ball?
4 m/s
2
5. A person decided to see how far they could walk in 10 s.
The data as given in 
Table 10.02.06 
was recorded.
(i) Draw a graph representing the data as given in 
Table
10.02.06
.
 
Time (s)
 
(ii) What is the distance travelled after 4 s?
8 metres.
 
Time (s)
 
(iii) How long did it take to travel 12 m?
6 seconds.
 
Time (s)
 
(iv) What was the walker’s speed at 5 s?
2 m/s.
 
Time (s)
 
(v) Comment on the shape of the graph.
Straight line graph through the origin.
A proportional relationship.
 
 
Time (s)
 
(vi) What does the shape of the line tell you about the speed of
the walker?
The walker was moving at a constant speed.
 
Time (s)
6. A cyclist cycled to work. His velocity was recorded over the
first minute of the cycle at 5 s intervals. The data as given in
Table 10.02.07 
was recorded.
(i) Draw a graph representing the data as given in 
Table 10.02.07
.
 
Time (s)
 
(ii) What is the cyclist’s velocity after 10 seconds?
5m/s
Time (s)
 
(iii) At what times was the cyclist’s velocity 10 m/s?
15 s and 60 s.
Time (s)
 
(iv) What was the cyclist’s acceleration after 20 seconds?
Acceleration = change in velocity/time taken
Acceleration = 12 – 0/20  Acceleration= 12/20 = 0.6 m/s
2
Time (s)
 
(v) Comment on the general shape of the graph, referring to specific
phases.
Acceleration between 0 and 20 s. Constant velocity between 20 and
50 s. The bike comes to an instant stop at 40 s until 45 s.
Acceleration again between 50 and 60 s.
Time (s)
 
(vi) Give a possible explanation for the sudden drop in velocity at 40 s
and 45 s.
Any reasonable explanation; e.g. red light, car pulling out, cyclist
tiring.
Time (s)
 
7. A stone was
dropped from
the top of a cliff
and the distance
that it fell was
measured at the
intervals of time
as given in 
Table
10.02.08.
(i)
Copy the grid
given in 
Fig. 10.02.17
(or use graph paper)
and draw a graph of
distance against
time. A smooth
curve through the
plotted points is
required.
 
(ii) Use the graph to find how far the stone had fallen in 3.5 s.
60 m.
 
(iii) Calculate the average speed of the falling stone between the
second and the fourth second. Give the unit with your answer.
30 m/s.
 
(iv) In this experiment, is distance fallen directly proportional to
time? Justify your answer.
No. The graph is not a straight line.
Slide Note

Note to teacher: All slides can be edited to suit your own classroom objectives. Slides with click and reveal boxes or animations will only work in slide show view and have specific instructions noted if needed.

Embed
Share

Explore the concepts of speed, velocity, and acceleration in physics, learn how to interpret distance-time and velocity-time graphs, and practice calculating the speed and acceleration of objects. Engage in experiments to calculate average speeds and write reports detailing procedures, variables, data collected, limitations, and conclusions. Delve into the relationship between velocity and acceleration when an object changes direction at constant speed.

  • Physics
  • Motion
  • Speed
  • Velocity
  • Experiment

Uploaded on Oct 03, 2024 | 0 Views


Download Presentation

Please find below an Image/Link to download the presentation.

The content on the website is provided AS IS for your information and personal use only. It may not be sold, licensed, or shared on other websites without obtaining consent from the author. Download presentation by click this link. If you encounter any issues during the download, it is possible that the publisher has removed the file from their server.

E N D

Presentation Transcript


  1. At the end of this unit you should: 1. Be able to state the relationship between speed, velocity and acceleration. 2. Be able to draw and interpret distance time graphs. 3. Be able to draw and interpret velocity time graphs. 4. Be able to calculate the speed, velocity and acceleration of objects.

  2. acceleration speed distance time distance time graph velocity rate of change velocity time graph

  3. LIGHTBULB QUESTION If a car is travelling at a constant speed and turns a corner (we assume it has not lost speed as it turns), both its velocity and acceleration change. Since the direction of speed has changed (say from east to north to west as in illustration) the velocity has changed. Since the velocity has changed, so has the acceleration.

  4. Speed: The distance an object in one unit of time. It can also be described as the rate of change of distance with respect to time. Unit: metre per second (m/s). Distance: The length of space between two points. Unit: metre (m). Time: A universal unit of measurement through which we measure events in the past, present and future. Unit: second (s)

  5. Investigation 10.02.01: To calculate the average speed of three wind-up toys Equipment: Three wind-up toys, a long, smooth surface and a stopwatch. Instructions: Calculate the average speed of three wind-up toys.

  6. 1. How would you make sure this was a fair test? All cars receive the same amount of wind-up. They compete over the same terrain and length of track.

  7. 2. Write a report on your experiment. Your report writing should contain the following: Statement of the problem/investigation being carried out; list of equipment; list of variables (independent and dependent); brief description of the procedure carried out; data collected (description and visually); limitations of study (error reporting etc.); conclusions.

  8. 3. Which toy was the fastest? Can you explain why? Consider examining the cars to determine what makes the fastest one so fast; for example, is it wheel size, or the length of the car, or the weight?

  9. (a) What is the formula for calculating distance? Speed = Distance/Time. (b) In what units are speed, distance and time measured? Speed is measured in metres per second (m/s). Distance is measured in metres (m). Time is measured in seconds (s).

  10. (c) Would it be a fair test to run 10 m to calculate your average speed for 100 m? Why/why not? No, it would not be a fair test as you are accelerating in the first 10 20 m of any sprint. (d) Calculate the speed of a person walking 100 m in 60 s. 1.67 m/s.

  11. (e) Calculate the speed of a person running 200 m in 24 s. 8.3 m/s. (f) How long does it take a car to travel 7 km at a speed of 14 m/s? Don t forget to convert 7 km into metres. 500 s or 8.3 min.

  12. (g) How far will a person walk in 1 hour if they walk at a speed of 1.5 m/s? Convert 1 hour into seconds (60 min x 60 s) = 3600 s x 1.5= 5400 m or 5.4 km. (h) Calculate the speed of a car travelling 2 km in 45 seconds. Don t forget to convert to SI units. 44.44 m/s. If you want to convert to km/h, multiply by 3 600 (converts seconds to hours) and divide that answer by 1 000 (converts metres to km) = 159.98 km/h.

  13. (i) Calculate the speed of a car travelling 10 km in 15 minutes. Don t forget to convert to S.I. 11.11 m/s. (j) How long does it take a truck to travel 15 km if it has a speed of 80 km/h? Don t forget to convert to SI units. 675.1 s or 11.25 min.

  14. (k) How far can a person get if they run at a speed of 8 m/s for 1 h and 10 min? Convert to SI units. 33 600 m or 33.6 km. (l) Compare the speed of the cars in (h) and (i). Car H is travelling approximately four times faster than car I.

  15. Velocity: Speed in a given direction. Unit: metre per second (m/s).

  16. (a) A person walks north for 190 m. They walk this distance in 24 seconds. What is their velocity? 7.92 m/s north. (b) Calculate the velocity of a rollercoaster if it covers 40 m in 1.5 s. 26.67 m/s. (We do not have a direction to supply as the information is not given.)

  17. (c) Which is faster: this rollercoaster in part (b) or a car covering 1 km in 35 s? What is the speed of this car in km/h? The rollercoaster travels at 26.67 m/s (as per previous questions). The car travels at 28.57 m/s. So the car travels faster. 28.57 m/s x 3600 = 102 857.14 m/h. 102 857.14 m/h/1000 = 102.86 km/h.

  18. (d) A car travels from Dublin to Galway a distance of 210 km in 2 h and 5 min. What is the velocity of the car? Convert to SI units. 28 m/s west.

  19. LIGHTBULB QUESTION Yes, as velocity changes with direction because it is a vector quantity (it has a size and direction).

  20. Acceleration: The change in velocity over time, or the rate of change of velocity with respect to time.

  21. LIGHTBULB QUESTION Speed is not the same as velocity. Since speed does not have a direction, we cannot equate speed and acceleration. We can only equate velocity and acceleration.

  22. (a) Which of these three examples involves acceleration? (i) A car changing its velocity from 10 m/s to 14 m/s. Car is accelerating as there is a change in velocity. (ii) A car travelling at a constant velocity. No acceleration, as no change in direction or velocity. (iii) A car changing its velocity from 14 m/s to 10 m/s. Change in velocity (slowing down), so there is a change in acceleration.

  23. (b) In Table 10.02.02 you will see a list of animals and their top speeds. These are not the speeds of these animals in nature. These are the speeds of the animals if they were the size of a human. Use the table to answer these questions.

  24. (b) (i) Which animal is the fastest? White- throated needletail.

  25. (b) (ii) What animal is the slowest? African bush elephant.

  26. (b) (iii) Explain, in your own words, why you think the mouse is as fast as the cheetah according to the table? The table lists the animals speed if they were all human-sized. So, if they were the same size, a mouse would be as fast as a cheetah.

  27. (b) (iv) Suggest one possible method for calculating the speed of the animals in their natural habitat. State how you would ensure it is a fair test. An observer would have to monitor the animals in their habitat, measure a set distance and time the animals when they run that distance. For it to be a fair test, all animals must run the same distance.

  28. (c) A car starting from rest accelerates to 15 m/s in 4 s. What is the acceleration of the car? 3.75 m/s2.

  29. (d) A car is moving at 27 m/s when it slams on the breaks and comes to a stop 1.2 s later. What is the acceleration of the car? -22.5 m/s2. Note the minus symbol indicates negative acceleration (deceleration).

  30. Table 10.02.04 shows the distance covered by a car starting from rest to 20 s later. (a) Represent the information in Table 10.02.04 in a graph.

  31. (i) How far had the car travelled after 2 min? 120 m.

  32. (ii) At what time did the car reach 60 m? 1 s.

  33. (iii) What was the speed of the car at 8 s and 10 s? Explain your answer. At both 8 s and 10 s the speed of the car is 60 m/s. The car is travelling at a constant velocity.

  34. (iv) Give the time taken for the car to reach 800 m. 800 m/60 m/s = 13.33 s.

  35. (v) Is the car accelerating? Justify your answer. Since the car is not changing its velocity (speed) and there is now mention of direction, we can say there is no acceleration.

  36. Tracking a jogger around a field, a graph of their movement can be seen in Fig. 10.02.07. Using this graph, answer these questions.

  37. (i) What is the velocity of the runner at 1 s? 4 m/s

  38. (ii) What is the velocity of the runner at 11 s? 6 m/s

  39. (iii) In your own words, describe the motion of the runner between 0 10 s. The runner is accelerating from rest to 8 m/s within 2 s. After these two seconds the runner maintains this velocity for 8 s.

  40. (iv) What do we call the motion of the runner between 210 s? Constant velocity.

  41. (v) Calculate the acceleration of the runner between 0 and 2 s. 4m/s2

  42. (vi) Calculate the acceleration of the runner between 10 and 12 s. -2 m/s2. Note the minus symbol indicates negative acceleration (deceleration).

  43. (vii) What is the acceleration of the runner between 18 and 20 s? -5 m/s2.

  44. Analysing DistanceTime Graphs Graph showing an object moving with constant velocity

  45. Analysing DistanceTime Graphs Graph showing an object moving with constant velocity towards its starting point

  46. Analysing DistanceTime Graphs Graph showing an object that is not moving (stationary)

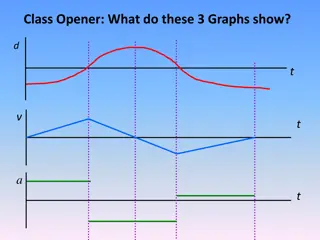
  47. Some graphs, like the one in Fig. 10.02.11, include all three conditions. Tell the story of this graph.

  48. From 0 to 4 s the object is moving at a constant speed. Between 4 and 6 s the object does not move; it stops at 40 metres. From 6 10 s the object is moving at a constant speed back towards the 0 metre mark (start line) (where the object started).

  49. Analysing VelocityTime Graphs Graph showing an object moving with constant acceleration

More Related Content

giItT1WQy@!-/#giItT1WQy@!-/#giItT1WQy@!-/#giItT1WQy@!-/#