Monitoring Delays in Adopting WHO HIV Treatment Guidelines in LMICs

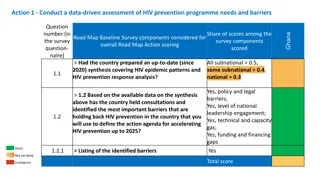
Scientific evidence supports immediate ART in preventing illness and deaths. WHO guidelines, revised in 2015 to recommend treating all PLHIV regardless of CD4 count, have seen delays in adoption at the national level in low- and middle-income countries (LMICs). This study quantifies delays in adopting the 2009, 2013, and 2015 WHO guidelines, highlighting the importance of timely implementation to reduce HIV-related morbidity and mortality.

Uploaded on Sep 26, 2024 | 3 Views
Download Presentation

Please find below an Image/Link to download the presentation.
The content on the website is provided AS IS for your information and personal use only. It may not be sold, licensed, or shared on other websites without obtaining consent from the author.If you encounter any issues during the download, it is possible that the publisher has removed the file from their server.
You are allowed to download the files provided on this website for personal or commercial use, subject to the condition that they are used lawfully. All files are the property of their respective owners.
The content on the website is provided AS IS for your information and personal use only. It may not be sold, licensed, or shared on other websites without obtaining consent from the author.
E N D
Presentation Transcript
Monitoring Delays in Adopting WHO HIV Treatment Guidelines in Low- and Middle-Income Countries Somya Gupta, Reuben Granich International Association of Providers of AIDS Care Presented at Adherence 2017 June 4 6, 2017 Miami
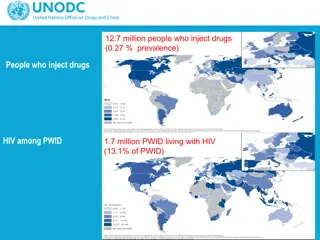
Introduction and Objective Scientific evidence demonstrates the benefits of immediate ART in preventing illness, deaths, transmission and costs WHO guidelines revised in 2015 to recommend treat all irrespective of CD4 cell count Mid-June 2016, 18.2M (50%) PLHIV on ART In 2015, there were 2.1M new HIV infections and 1.1M AIDS- related deaths National guidelines often use WHO guidelines as reference Quantify delays in national level adoption of the 2009, 2013 and 2015 WHO guidelines in low- and middle- income countries (LMICs)
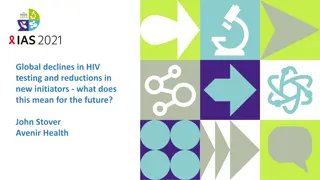
ART Eligibility Criteria (123 countries) <200, <250 or <300 <350 <500 >500 Treat all in 48 countries (63% burden) Irrespective of CD4 count Last updated: June, 2017 Source: www.HIVpolicywatch.org
Methodology HIVpolicywatch.org IDENTIFICATION (218) 218 guidelines (2001-2017) from 91 LMICs (92% global HIV burden in 2015) Excluded 12 guidelines (7 LMICs) recommending ART at CD4 <200 or <250 [new guidelines not available] SCREENING (218) 218 guidelines from 91 LMICs screened for date of publication and ART eligibility criteria Excluded 39 old guidelines from 84 LMICs recommending ART at CD4 <200 [updated guidelines available] Excluded 44 guidelines from 84 LMICs that adopted a recommendation before WHO and in which eligibility criteria did not change DATA ANALYSIS (123) From 123 guidelines from 84 countries, no. of months taken to adopt the WHO 2009, 2013 and/or 2015 guidelines calculated Average time lag to adopt WHO 2009 guidelines WHO 2013 guidelines WHO 2015 guidelines
ART Eligibility Criteria (84 countries) <350 <500 Irrespective of CD4 count Guidelines not included in analysis 84 low- and middle-income countries (91% global HIV burden) 30 (58% burden) recommend treat all Last updated: June, 2017
Policy Lag in LMICs (84 countries) WHO 2009 guidelines WHO 2013 guidelines WHO 2015 guidelines Date of publication October, 2009 June, 2013 September, 2015 Irrespective of CD4 count ART eligibility criteria <350 cells/mm3 <500 cells/mm3 Average time to adopt the WHO guidelines 25 [3-68] months (n = 49) 14 [0-39] months (n = 53) 11 [1-20] months (n = 23) Countries yet to adopt the recommendation 22 54 0 (6% burden) (33% burden) Data as of June, 2017
ART Eligibility Criteria Sub-Saharan Africa (34 countries) <350 <500 Irrespective of CD4 count Countries not included in the analysis Region accounts for 69% of the global HIV epidemic Last updated: June, 2017
Timeline showing release of WHO guidelines and guidelines from 34 countries in Sub-Saharan Africa Oct 2009 June 2013 Sep 2015 June - Dec 2013 Jan Aug 2015 Jan - Sep 2009 Jan - Dec 2016 2014 2011 2006 - 2008 2012 2010 WHO 2013 guidelines (CD4 <500 cells/mm3) WHO 2009 guidelines (CD4 <350 cells/mm3) JANUARY Swaziland 2006 Sierra Leone JUNE Niger JANUARY Mozambique JUNE Cote d Ivoire JANUARY Namibia Sudan JANUARY Swaziland FEBRUARY Angola APRIL Lesotho WHO 2015 guidelines (Irrespective of CD4 count) APRIL Botswana South Africa Tanzania MAY JUNE Guinea Uganda MAY MAY Malawi Zimbabwe Tanzania MARCH South Sudan 2007 Lesotho Rwanda JUNE Ethiopia Madagascar JUNE Zambia JUNE Botswana JULY Malawi JULY 2008 Mali Djibouti Ghana Burkina Faso APRIL Lesotho Malawi JULY Namibia JUNE Benin Democratic Republic of the Congo JULY Kenya Rwanda NOVEMBER Kenya OCTOBER Ethiopia JUNE Cameroon Gabon Kenya Nigeria AUGUST Democratic Republic of the Congo NOVEMBER Mali SEP Burundi Mozambique South Africa DECEMBER Rwanda Uganda Zambia Zimbabwe OCTOBER Burundi Nigeria AUGUST Burundi Liberia Mauritania NOVEMBER Uganda Zambia DECEMBER Namibia Zimbabwe DECEMBER South Africa Note: Red box denotes move to the WHO 2009 guidelines [CD4 count <350 cells/mm3], green box denotes move to the WHO 2013 guidelines [CD4 count <500 cells/mm3], and blue box denotes move to the WHO 2015 guidelines [irrespective of CD4 count].
Policy Lag in Sub-Saharan Africa 34 countries WHO 2009 guidelines WHO 2013 guidelines WHO 2015 guidelines Date of publication October, 2009 June, 2013 September, 2015 ART eligibility criteria Irrespective of CD4 count <350 cells/mm3 <500 cells/mm3 Average time to adopt the WHO guidelines 24 [3-56] months (n=21) 12 [0-39] months (n=24) 12 [7-15] months (n=12) Countries yet to adopt the recommendation 9 22 (4% burden) (24% burden) Search end date: June, 2017
Adoption of Treat all (48 countries) Botswana, Burundi, Cambodia, China, Haiti, Japan, Kenya, Lao PDR, Lesotho, Malawi, Malaysia, Mozambique, Namibia, Norway, Poland, Portugal, Rwanda, South Africa, Sri Lanka, Uganda, Zambia, Zimbabwe Mexico Spain Sweden Thailand United States Netherlands 2011 2012 2013 2014 2015 2016 2017 India Jamaica Papua New Guinea Denmark Italy WHO Australia Brazil France Romania South Korea Turkey Argentina, Austria, Croatia, Georgia, Germany, Maldives, Montenegro, Switzerland, United Kingdom Countries in yellow are high-income countries
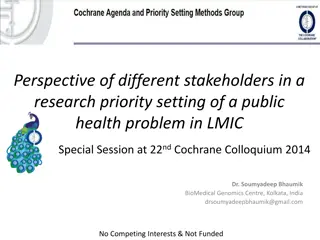
Per capita income vs. adoption of treat all 30 Months taken to adopt treat all relative to 20 10 0 WHO -10 -20 -30 -40 -50 Upper middle income Lower middle income Low income High income -60 Per capita income (2015, in US$)
Limitations Guidelines were not available for some countries Guidelines may be outdated or in the process of being updated Used published national guidelines for analysis, which may not reflect programme implementation or clinical practice
Conclusions The time to adoption of the 2015 guidelines appears accelerated, but if the trajectories for the adoption of WHO 2009 & 2013 guidelines are followed, it may take many years for WHO 2015 guidelines to become national policies There is an urgent need to shorten the time lag in adoption and implementation of the new WHO guidelines recommending treat all to accelerate ART coverage With adoption and implementation of the guidelines, there is a need to strengthen service delivery, including retention and adherence, to achieve 90-90-90 by 2020


")

")
")


")