Model Evaluation in Meteorology
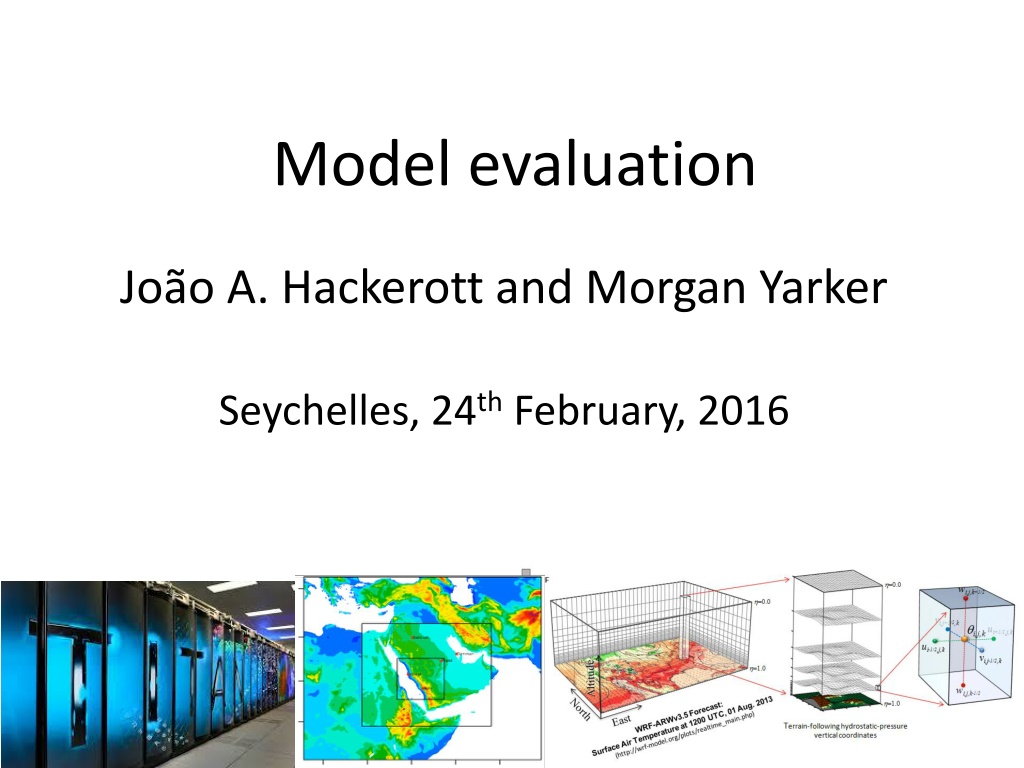

Model evaluation
João A. Hackerott and Morgan Yarker
Seychelles, 24
th
February, 2016


Why verify?
Hypothesis
1)
Disagree
with a fact.
2)
Elaborate
hypothesis.
3)
Proof
the hypothesis.
4)
Develop
improvement.
Example:
I ran WRF for 3 month on my hometown and it was
under
estimating the rainfall
.
Fact:
Model simulates rain
within an accepted error.
Hypothesis
: Problems in
Cumulus Parameterization.
Proof
: Compare to others.
Develop
: Apply the change
on operation.
I decided to change the
cumulus parameterizations
since I verified that the problems were occurring
during convective days.
I changed from Tiedtke to KF and after 3 more
months, the
verification improved
.


Accepted error…
But, what is an error?
Which parameterization?
Resolution
Sea breeze
: ~80km -> need around 10km grid space.
Which grid space?
Gs = L
Gs = L/2
Gs = L/3
Gs = L/4
Gs = L/8
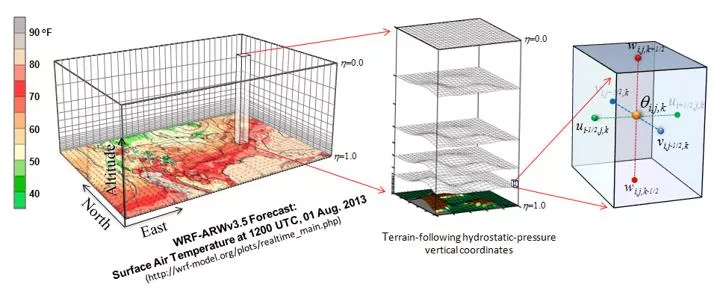
Resolution
Which model should I use?
Altitude (m)
0,5°
27 km
9 km
3 km
Pay attention to the vertical resolution as well!
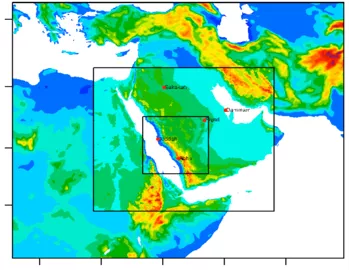
Domain’s size
Attention where is your interest!
1
st
domain has to resolve the
synoptic conditions.
The domains must be large!
Large domain
Small domain
Same resolution
Computational error
Suppose a perfect model
(physics and initial conditions)
The forecast will not be
perfect due to
truncations
Because of nonlinearity of meteorological equations, small
deviation may increase significantly with time.
Example of chaotic equation
Initial condition error
Analysis is not perfect!
•
Grid interpolation.
•
Observational problems.
•
Lack of data.
•
It is a model simulation.
www.meted.ucar.edu /bom/mdata_assim/
Summary of model error
Chaos / truncation
Analysis
Unsolved physics
(Warner, 2011)
Observation
Observed data for model verification
Observed data are not the absolute truth!
We can’t know the complete reality…
You must be tuff (exigent) about your comparison!!!
Observations generally are more “true” than a model analysis and re-analysis
(at least they are relatively more independent).
Observational uncertainty should be somehow taken into account.
Compare to observations…
(Warner, 2011)
Dichothomus evaluation
Probability of right tornado forecasted = 30/50 = 60%
These tables are easy to produce and give you valuable information
Can be used also for thresholds.
Example:
Temperature less than 20°C.
Percentage of correct forecast = (30+2680)/2800 = 97%
Indices based on conditioning
•
Hit Rate (Prob. Of Detction) =a/(a+c)
•
False Alarme Tate = b/(b+d)
•
Probability of detaction= 1-b/(b+d)
•
False alarme ratio = b/(a+b)
•
Frequency bias (a+b)/(a+c)
•
Critical success index = a/(a+b+c)
MET software
Download observational data
Model evaluation in meteorology involves verifying, hypothesizing, proving, and improving models through a systematic process. Factors such as error analysis, grid spacing, model resolution, domain size, computational errors, chaotic equations, and initial condition errors play critical roles in assessing the accuracy and reliability of weather models. Addressing these aspects helps meteorologists enhance forecast accuracy and mitigate uncertainties in atmospheric predictions.

Download Presentation

Please find below an Image/Link to download the presentation.
The content on the website is provided AS IS for your information and personal use only. It may not be sold, licensed, or shared on other websites without obtaining consent from the author.If you encounter any issues during the download, it is possible that the publisher has removed the file from their server.
You are allowed to download the files provided on this website for personal or commercial use, subject to the condition that they are used lawfully. All files are the property of their respective owners.
The content on the website is provided AS IS for your information and personal use only. It may not be sold, licensed, or shared on other websites without obtaining consent from the author.
E N D
Presentation Transcript
Model evaluation Jo o A. Hackerott and Morgan Yarker Seychelles, 24thFebruary, 2016
Why verify? 1) Disagree with a fact. 2) Elaborate hypothesis. Hypothesis 3) Proof the hypothesis. 4) Develop improvement. Example: Fact: Model simulates rain within an accepted error. I ran WRF for 3 month on my hometown and it was under estimating the rainfall. Hypothesis: Problems in Cumulus Parameterization. I decided to change the cumulus parameterizations since I verified that the problems were occurring during convective days. Proof: Compare to others. I changed from Tiedtke to KF and after 3 more months, the verification improved. Develop: Apply the change on operation.
Accepted error But, what is an error? Which parameterization?
Resolution Which grid space? Gs = L Gs = L/3 Gs = L/2 Gs = L/4 Gs = L/8 Sea breeze: ~80km -> need around 10km grid space.
Resolution 0,5 Which model should I use? Pay attention to the vertical resolution as well! 27 km 9 km 3 km Altitude (m)
Domains size Same resolution Large domain Small domain 1stdomain has to resolve the synoptic conditions. The domains must be large! Attention where is your interest!
Computational error Chaos theory (Lorenz, 1963) Suppose a perfect model (physics and initial conditions) The forecast will not be perfect due to truncations Because of nonlinearity of meteorological equations, small deviation may increase significantly with time.
Initial condition error Analysis is not perfect! Grid interpolation. Observational problems. Lack of data. It is a model simulation. www.meted.ucar.edu /bom/mdata_assim/
Summary of model error Unsolved physics Observation Chaos / truncation Analysis (Warner, 2011)
Observed data for model verification Observed data are not the absolute truth! We can t know the complete reality Observations generally are more true than a model analysis and re-analysis (at least they are relatively more independent). Observational uncertainty should be somehow taken into account. You must be tuff (exigent) about your comparison!!!
Compare to observations (Warner, 2011)
Dichothomus evaluation Probability of right tornado forecasted = 30/50 = 60% Percentage of correct forecast = (30+2680)/2800 = 97% These tables are easy to produce and give you valuable information Can be used also for thresholds. Example: Temperature less than 20 C.
Indices based on conditioning Hit Rate (Prob. Of Detction) =a/(a+c) False Alarme Tate = b/(b+d) Probability of detaction= 1-b/(b+d) False alarme ratio = b/(a+b) Frequency bias (a+b)/(a+c) Critical success index = a/(a+b+c)