Michigan Future Business Index Q2 2023 Insights
Insights from the Michigan Future Business Index Q2 2023 survey reveal that concerns for a deepening recession are softening, although wage inflation remains high. Sales and profits have seen declines, with hiring and investments holding steady. Overall satisfaction with the economy has improved, indicating a positive outlook among small to medium-sized businesses.
Download Presentation

Please find below an Image/Link to download the presentation.
The content on the website is provided AS IS for your information and personal use only. It may not be sold, licensed, or shared on other websites without obtaining consent from the author.If you encounter any issues during the download, it is possible that the publisher has removed the file from their server.
You are allowed to download the files provided on this website for personal or commercial use, subject to the condition that they are used lawfully. All files are the property of their respective owners.
The content on the website is provided AS IS for your information and personal use only. It may not be sold, licensed, or shared on other websites without obtaining consent from the author.
E N D
Presentation Transcript
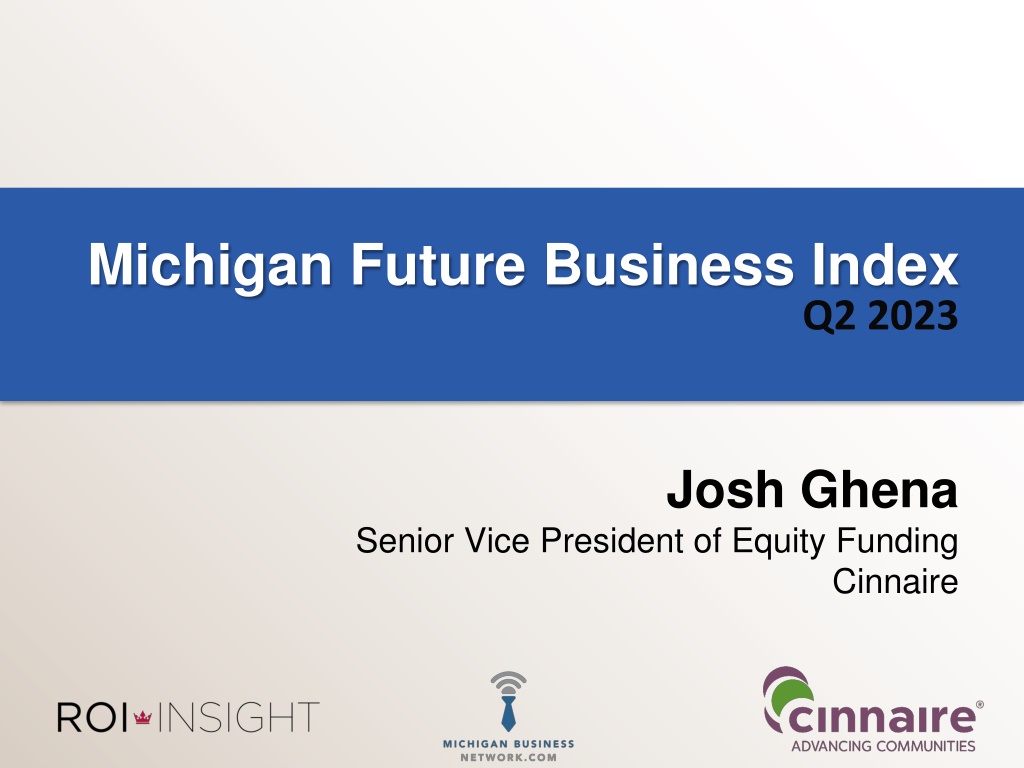
Michigan Future Business Index Q2 2023 Josh Ghena Senior Vice President of Equity Funding Cinnaire
Michigan Future Business Index Methodology Statewide survey of 836 small to medium-sized businesses; 615 completed the survey Mixed-mode survey, conducted online and by phone Commissioned by Cinnaire & Michigan Business Network Conducted by ROI Insight Field Dates: May 22 through June 27, 2023
Key Takeaways Even though the impacts of a weakening economy have emerged on the list of top challenges to doing business in Michigan in the past six months, overall concern for a deepening recession or continued inflation appears to be softening. While the impacts of wage inflation remain high, they appear to have crested. Sales and profits both saw a decline over the past six months, with profit increases hitting a record low for the MFBI. That said, overall satisfaction with the business economy has improved significantly since last year, with half now saying they are satisfied with the economy. A majority now say they ve fully recovered from the COVID-19 pandemic and comments to open-end questions indicate that small business owners are becoming bullish on Michigan s future economy.
The Past Six Months Except for hiring and wages, most indicators for the past six months have declined, with profit increases hitting a record low. While still high, wage increases dropped slightly from record level Six in ten (60%) say their employee wages have increased in last six months, down two points from last year. Sales increases dropped since last year Thirty-five (35%) say sales have increased in the last six months, down five points since last year. Profit increases have hit a record low Fewer than two in ten (19%) report profit increases, setting an MFBI record low. Hiring has held steady, while layoffs decreased slightly More than two in ten (22%) say they have hired new employees, no change from 2022. Investments dropped slightly Those reporting increased capital investments dropped two points to 22%, while those reporting decreases increased two points to 14% from one year ago.
Trending The Indicators: Wages 3%6% Past Six Months Wages 31% Increase Stay Same Decrease DNA 5962 6260 60% 53 4850 46 4346 44 4442 4340 37 36 3027 2725 COVID-19 14 15 Has wage inflation crested?
Trending The Indicators: Sales Past Six Months 49 4950 48454649 33353840414245 44 4043 4240 40 40 5% 35 32 Increase Stay Same Decrease DNA 25% 35% Sales Those reporting a decrease in sales up 4 points from last June COVID-19 35%
Trending The Indicators: Profits 19% 3% Past Six Months 35% Profits Increase Stay Same Decrease DNA 43% 38 37 3532 30 313432 3331 292729 29 30 27 252325 21 22 21 19 COVID-19 Profit increases down six, decreases five, and no change up 10 since last June. Plurality holding steady
Trending The Indicators: Number of Employees 4% Past Six Months 22% 18% Increase Stay Same Decrease DNA Employees 3129 3032 56% 28 27 25 26 25 25 22 21 22 201820 21 22 22 COVID-19 20 21 12 11 Those reporting a decrease in employees down 2 points from one year ago, most holding steady.
Trending The Indicators: Capital Investments 22% 24% Past Six Months Increase Equip- ment/ Facilities Stay Same Decreased DNA 14% 40% 28 28 29 2825 26 2725222527 27 192225 2422 COVID-19 20 19 19 1821 22 June '11 June '12 June '14 June '15 June '16 June '18 June '19 June '21 June '22 June '23 Nov'15 Nov '13 Nov '14 Nov '16 Nov '17 Nov '18 Nov '19 Nov '21 Nov '22 Oct '11 Oct '12 May '13 July '17
Satisfaction with Economy Satisfaction with the business economy rebounds. Half now say they are satisfied with the economy. The percentage of those saying they are dissatisfied with the economy dropped six points since Q4 2022 to 50%; 33% somewhat dissatisfied and 17% very dissatisfied Down from 55% dissatisfied one year ago 50% now say they are satisfied with the economy; 42% somewhat and 8% very satisfied Up from 45% one year ago Though softening, intensity is still strongest among the dissatisfied. Retail/Food Service (51%) and Business & Professional Services sectors (49%) are now most likely to be satisfied with the economy, while Insurance/Finance/Real Estate (64%) and Non-Profit/Health Care (61%) sectors are most dissatisfied, which is a flip from Q2.
Satisfaction with Economy Trends As it Affects Your Business 84 82 82 8182 8180 80 79 78 77 76 76 73 71 70 69 69 67 6667 66 66 62 5657 5556 5455 55 Dissatisfied Satisfied 52 52 48 50 50 48 4544 4443 43 41 34 34 32 32 31 29 29 29 29 28 27 COVID-19 22 2021 20 1918 1918 18 1817 1514 11
Greatest Challenges To Doing Business Inflation remains the top challenge. Supply chain issues drop again. Weakening economy emerges in top four. Since Q4 22 Nov 2019 June 2021 Nov 2021 June 2022 Nov 2022 June 2023 Inflation 23% 29% 52% 52% 46% -6 Acquiring Talent 46% 49% 45% 46% 41% 35% -6 Wage Inflation 19% 27% 23% 24% 32% 26% -6 New Economy Weakening 25% Cost of Health Insurance 40% 25% 25% 19% 24% 23% -1 +7 Government Regulations 19% 17% 12% 15% 22% Retaining Talent 25% 26% 23% 24% 25% 20% -5 Finding Customers 28% 22% 17% 14% 21% 20% -1 Multiple responses were accepted. Percentages add up to more than 100%. Supply Chain Challenges 34% 35% 24% 17% -7 Taxes 23% 17% 17% 12% 16% 15% -1 Retaining Customers 16% 14% 8% 10% 11% 14% +3 Access to Capital 10% 3% 5% 5% 7% 9% +2
Greatest Reasons for Optimism Optimism for Opportunity, Demand, Innovation Since Q4 22 Q4 2019 Q2 2021 Q4 2022 Q2 2022 Q4 2022 Q2 2023 Demand For Products/Services 17% 15% 18% 13% 16% 14% -2 No Change Business Growth/Expansion 11% 17% 18% 15% 14% 14% Great Customers 13% 10% 11% 11% 12% 13% +1 More Opportunities 6% 8% 5% 5% 8% 10% +2 My Staff/Team/Employees 7% 7% 6% 9% 12% 7% -5 +4 Politics/Hope For Reforms 5% 4% 5% 4% 2% 6% -1 Flexible/Nimble/Innovative 1% 5% 5% 2% 5% 4% The Economy 10% 8% 3% 3% 5% 4% -1 Longevity/Resilience/Still Going 7% 5% 2% 4% 4% No Change Business Is Good 4% 7% 2% 2% 4% 3% -1 No Change End of COVID-19 Pandemic 9% 7% 3% 2% 2%
Emerging From Covid How Is Your Business Doing Now? Pretty good/Excellent Not so good/Poor Just Okay/Surviving 90% 81% 77% 80% 70% 60% 52% 51% 50% 49% 50% 43% 42% 40% 34% 33% 33% 33% 27% 31% 30% 24% 18% 27% 15% 15% 20% 24% 16% 15% 10% 4% 8% 0% Pre COVID-19 Q2 2020 Q4 2020 Q2 2021 Q4 2021 Q2 2022 Q4 2022 Q2 2023
Emerging From COVID-19 When do you expect to fully recover? -6 Since One Year Ago 15.10% +13 Already fully recovered By Q3 2023 By Q4 2023 50.32% 24.35% Sometime in 2024 or after I'm not sure my business will ever fully recover 7.95% 2.27%
Sales & Profit Projections Improving Projections for sales and profits are improving. Projections for decreased profits have retreated from record levels in Q4 2022. Projected sales growth at 46% up one point from six months ago. Expectations for sales decreases dropped from a record level of 17% in November to 11% now. Now only eighteen percent (18%) expect profits to decline in the next six months. That s a drop of nine points since November. The percentage of those believing profits will increase holds steady at 36%. Expectations for sales growth is now highest in the Retail/Food Service sector (53%) and lowest in the Non-Profit/Health Care sector (43%). Profit increases are most expected in the Retail/Food Service (42%) and lowest in the Finance/Insurance/Real Estate sector (29%)
Projected Sales Trends Over The Next Six Months ... 68 66 63 62 62 61 61 60 60 59 58 57 57 53 50 50 48 46 Increase Decrease No Change 45 44 43 40 42 40 39 40 40 38 37 37 35 34 33 32 32 32 31 30 30 29 29 28 26 26 26 25 COVID-19 17 16 13 13 11 11 11 10 9 8 7 7 7 6 6 6 5 5 5 5 4 3 3
Projected Profit Trends Over The Next Six Months ... 58 56 56 54 54 53 53 52 50 50 49 49 No Change 45 Increase Decrease 44 43 43 41 40 39 40 40 37 39 39 35 38 37 37 33 36 36 36 35 36 35 35 34 34 33 33 32 32 32 32 31 30 27 27 22 21 20 20 18 COVID-19 17 16 16 15 11 11 10 10 9 9 8 8 8 8 7 7
Most Maintaining Current Staff Levels Now a clear majority (55%) of respondents say they will maintain current staffing levels, while fewer than four in ten (36%) say they plan to hire more employees. That s the lowest hiring projections have been since before the COVID pandemic. Layoff projections are again down to five percent. Thirty-six percent (36%) say they plan to hire more employees over the next six months. This is the third consecutive MFBI indicating a hiring slowdown. Fifty-five percent (55%) will maintain staff at current levels, up seven points from one year ago. Only five percent (5%) say they plan to lay off employees, back down to 21 levels. The Manufacturing/Construction sector (41%) is most likely to be hiring in the next six months, while the Health Care/Non-Profit sector is least likely to be hiring in the next six months (27%).
Projected Hiring Trends 74 74 73 71 70 69 68 68 68 65 61 60 60 60 59 58 58 57 57 57 56 56 55 55 54 53 53 50 49 48 48 46 44 Lay-off Hire Maintain 44 42 41 40 40 39 38 37 37 36 36 34 34 34 33 31 30 29 26 24 COVID-19 19 18 17 13 16 16 16 15 14 14 14 13 11 12 12 11 10 10 10 10 10 9 9 8 8 8 7 6 6 5 5 5 5 4 4 4 4 4 4 4 3 3 3 May '06 Nov '06 Nov '07 Jan '10 May '13 Nov '13 Nov '14 Nov '15 Nov '16 Nov '17 Nov '18 Nov '19 Nov '21 Nov '22 Apr '08 Nov '08 Apr '09 July '17 May '07 Oct '10 June '11 Oct '11 June '12 Oct '12 June '14 June '15 June '16 June '18 June '19 June '21 June '22 June '23
While Difficulties Remain, Talent Acquisition is Improving Thirty-two percent (32%) say their access to qualified talent is pretty good or excellent, up three points from one year ago. Fifty-eight percent (58%) rate their access to qualified talent as only fair or poor, down five points. Nearly six in ten (59%) are having difficulty filling open jobs, which is down five points from last year. Down one point from a year ago, 79% of those actively searching for talent are having difficulty. 39% attribute that difficulty to a lack of any applicants down 18 points from a year ago 47% attribute it to a lack of qualified applicants up 18 points from a year ago.
Has Wage Inflation Crested? Reminder: earlier in the survey, sixty percent (60%) said they ve already raised wages in the past six months and wage inflation remains as the third most significant challenge (26%) to doing business in Michigan. However, fewer than four in ten (38%) say they will continue to raise wages in the next six months, down six points from November. A majority (55%) say they will not raise wages. Projections for continued wage growth are strongest in the Health Care/Non-Profit (48%) and Manufacturing/Construction sectors (45%).
Projected Wage Trends 78 78 76 75 73 72 70 69 68 68 67 67 65 63 63 62 62 58 58 55 55 53 53 53 53 53 52 52 51 45 Not Increasing Wages Increasing Wages 49 46 49 46 48 47 42 42 41 40 40 38 38 38 35 35 35 34 34 32 30 28 28 COVID-19 26 24 24 22 20 20 20 18 17 14 13 * Only 0.7% Decreasing Wages Nov '13 Nov '06 Nov '07 Nov '08 Oct '10 Oct '11 Oct '12 Nov '14 Nov '15 Nov '16 Nov '17 Nov '18 Nov '19 Nov '21 Nov '22 Jan '10 July '17 May '06 May '07 Apr '08 Apr '09 May '13 June ' 12 June '11 June '14 June '15 June '16 June '18 June '19 June '21 June '22 June '23
Projected Investments & Growth A majority (55%) plan to invest in employee training within the next 6 months up two points from one year ago, but down six from November. More than half (53%) will invest in advertising up one point from one year ago. One quarter (25%) plan to invest in new equipment up one point from a year ago. Over one-third (37%) plan to expand their business with a new product line or service up five points from one year ago.
Conclusions: Inflation worries continue but they are softening. In addition, wage inflation appears to have reached its peak. Satisfaction with the economy is rebounding. While sales and profits took a dip over the last six months, projections for future sales and profits are improving, as wage increases and projections for further increases are slowing. As job creators are pulling back on hiring, they are focusing on finding success with their existing teams. Most now say they ve fully recovered from COVID-19 pandemic, and many say supply chain challenges are becoming less significant.
Conclusions: Michigan is a great place to have a small business! 66% now believe Michigan remains a pretty good (53%) to excellent (14%) market for their business up four points from November. 63% say our state business taxes as mostly (57%) to very (6%) fair up one point from November.
Thank you! We appreciate your interest in the MFBI. For more information or detailed findings, please contact Michigan Business Network. http://www.michiganbusinessnetwork.com 109 E. Oakland Ave. P.O. Box 15279 Lansing, MI 48906 (517) 755-9649
 undefined


