Medicare Beneficiaries Supplemental Coverage Insights


SOURCE: Kaiser Family Foundation analysis of the CMS Medicare Current Beneficiary Survey Cost and Use File, 2010.
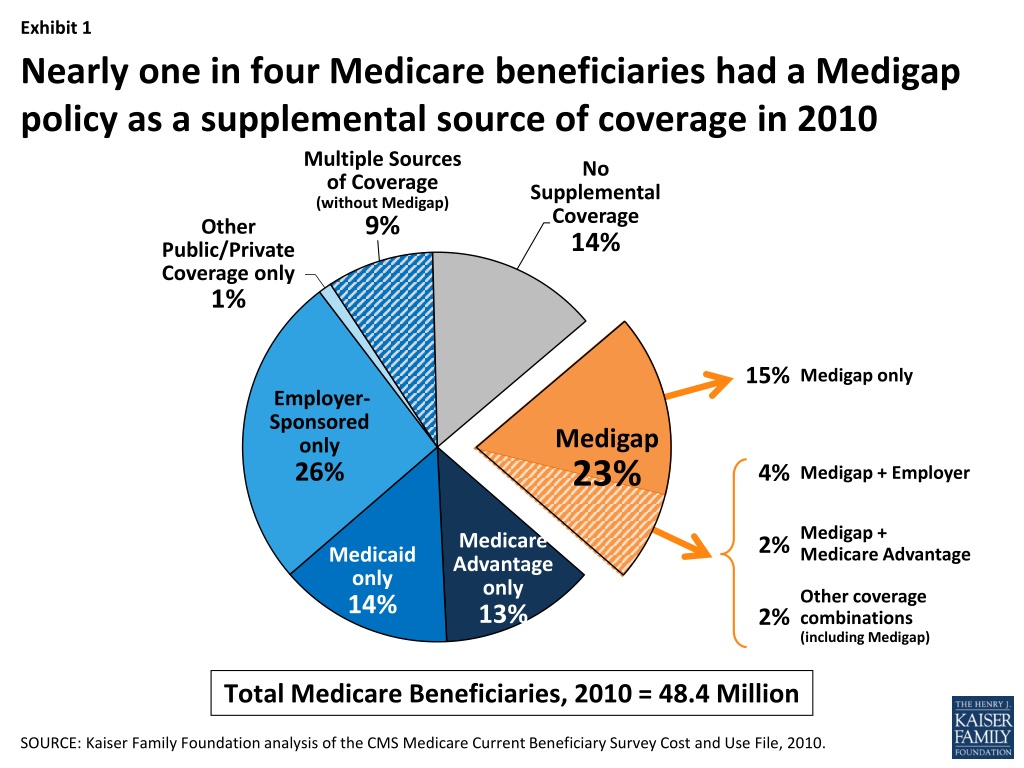
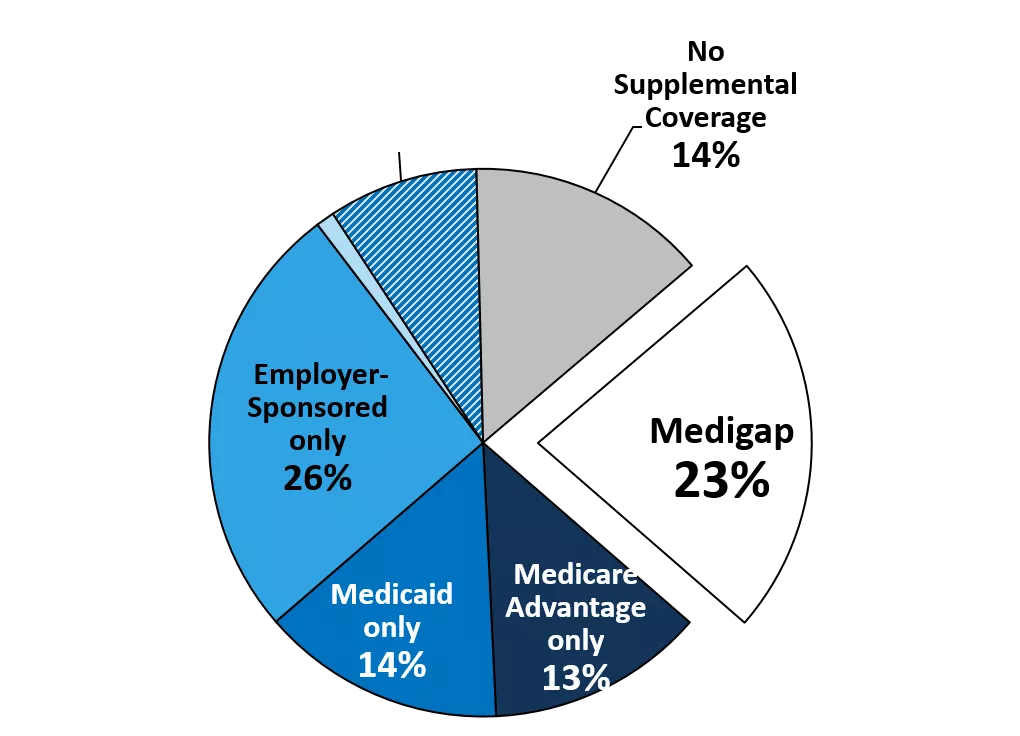
Nearly one in four Medicare beneficiaries had a Medigap
policy as a supplemental source of coverage in 2010
Other
Public/Private
Coverage only
1%


Total Medicare Beneficiaries, 2010 = 48.4 Million

Multiple Sources
of Coverage
(without Medigap)
9%
NOTE:
Analysis excludes California, as the majority of health insurers do not report their data to the NAIC. Analysis includes standardized plans A-N, policies
existing prior to federal standardization, plans in Massachusetts, Minnesota, and Wisconsin that are not part of the federal standardization program, and
plans that identified as Medicare Select; excludes plans where number of covered lives was less than 20. Number of Medigap policyholders as of December
31, 2010, as reported in the NAIC data.
SOURCE:
K. Desmond, T. Rice, and Kaiser Family Foundation analysis of 2010 National Association of Insurance Commissioners (NAIC) Medicare Supplement
data. Kaiser Family foundation and Mathematica Policy Research analysis of CMS State/County Market Penetration Files.
Percent of Medicare Beneficiaries with Medigap by State,
All Plans, 2010
National Average = 23%
NOTE:
Numbers do not sum due to rounding.
SOURCE:
Kaiser Family Foundation analysis of the CMS Medicare Current Beneficiary Survey Cost and Use File, 2010.
Distribution of Income of Medicare Beneficiaries,
by Source of Supplemental Coverage, 2010
SOURCE:
K. Desmond, T. Rice, and Kaiser Family Foundation analysis of 2010 National Association of Insurance Commissioners
(NAIC) Medicare Supplement data.
Share of Medicare Beneficiaries with
Medigap Plans C and F, 2010
National Average = 12%
EXHIBIT 4
Share of Medigap Policyholders by All Plan Types, 2010
Total Number of Medigap Policyholders, 2010= 9.3 million
NOTE:
Analysis excludes California, as the majority of health insurers do not report their data to the NAIC. Analysis includes standardized plans A-N, policies existing prior to federal
standardization (PreStandardization), and plans in Massachusetts, Minnesota, and Wisconsin that are not part of the federal standardization program; includes plans that identified as
Medicare Select; excludes plans where number of covered lives was less than 20. Number of Medigap policyholders as of December 31, 2010, as reported in the NAIC data.
SOURCE:
K. Desmond, T. Rice, and Kaiser Family Foundation analysis of 2010 National Association of Insurance Commissioners (NAIC) Medicare Supplement data.
NOTE:
Analysis excludes California, as the majority of health insurers do not report their data to the NAIC. Analysis includes standardized plans A-J; excludes
plans K-L because of the small number of policyholders enrolled in these plans; excludes policies existing prior to federal standardization; excludes plans in
Massachusetts, Minnesota, and Wisconsin; excludes plans that identified as Medicare Select; excludes plans where number of covered lives was less than 20.
SOURCE:
K. Desmond, T. Rice, and Kaiser Family Foundation analysis of 2008-2009 National Association of Insurance Commissioners (NAIC) Medicare
Supplement data.
Distribution
of Monthly Medigap Premiums, Plans A – J,
2010
90
th
percentile
National
average
premium
10
th
percentile
National Average = $181
NOTE:
Analysis excludes California, as the majority of health insurers do not report their data to the NAIC. Analysis includes standardized plan F; excludes
plans that identified as Medicare Select; excludes plans where number of covered lives was less than 20.
SOURCE:
K. Desmond, T. Rice, and Kaiser Family Foundation analysis of 2008-2009 National Association of Insurance Commissioners (NAIC) Medicare
Supplement data.
Average Monthly Medigap Premiums for Plan F,
by State, 2010
NOTES:
Check marks indicate 100 percent benefit coverage. Amount in table is the plan’s coinsurance amount for each covered benefit after
beneficiary pays deductibles or cost-sharing amounts, where applicable. The Affordable Care Act eliminated cost-sharing for preventive benefits rated
A or B by the U.S. Preventive Services Task Force, effective 2011.
1
After June 1, 2010, Medigap Plans E, H, I, and J are no longer available for purchase
by new policyholders; existing policyholders may remain in these plans.
2
Benefits for Plan G reflect the standard benefit after June 1, 2010 (Part B
excess charges changed from 80% to 100%).
3
Medigap Plans K and L available for purchase in 2005.
4
Medigap Plans M and N available for purchase
after June 1, 2010. *Plan N pays 100% of the Part B coinsurance except up to $20 copayment for office visits and up to $50 for emergency
department visits.
SOURCE:
Centers for Medicare & Medicaid Services, 2013 Guide to Health Insurance, February 2013.
Standard Medigap Plan Benefits, 2013
Table A2
No change
Explore data on the distribution of Medicare beneficiaries with Medigap policies as supplemental coverage, state-wise Medigap prevalence, income levels across coverage sources, and share of beneficiaries with Medigap Plans C and F in 2010.

Download Presentation

Please find below an Image/Link to download the presentation.
The content on the website is provided AS IS for your information and personal use only. It may not be sold, licensed, or shared on other websites without obtaining consent from the author.If you encounter any issues during the download, it is possible that the publisher has removed the file from their server.
You are allowed to download the files provided on this website for personal or commercial use, subject to the condition that they are used lawfully. All files are the property of their respective owners.
The content on the website is provided AS IS for your information and personal use only. It may not be sold, licensed, or shared on other websites without obtaining consent from the author.
E N D
Presentation Transcript
Exhibit 1 Nearly one in four Medicare beneficiaries had a Medigap policy as a supplemental source of coverage in 2010 Multiple Sources of Coverage (without Medigap) 9% No Supplemental Coverage 14% Other Public/Private Coverage only 1% 15% Medigap only Employer- Sponsored only 26% Medigap 23% 4% Medigap + Employer 2%Medigap + Medicare Advantage Medicare Advantage only 13% Medicaid only 14% Other coverage combinations (including Medigap) 2% Total Medicare Beneficiaries, 2010 = 48.4 Million SOURCE: Kaiser Family Foundation analysis of the CMS Medicare Current Beneficiary Survey Cost and Use File, 2010.
Exhibit 2 Percent of Medicare Beneficiaries with Medigap by State, All Plans, 2010 National Average = 23% 21% 28% 35% 51% 30% 30% 21% 20% 19% 12% 16% 26% 50% 24% 22% 27% 26% 38% 27% 49% 47% 22% 21% 19% 13% 33%29% 17% 15% 24% DC 9% 17% 22% 46% 27% N/A 25% 16% 22% 24% 29% 13% 19% 25% 20% 25% 17% 12% 19% 2% 19% 0%-15% (6 states, DC) 16%-20% (12 states) 21%-25% (13 states) 26%-30% (10 states) 31%-40% (3 states) More than 40% (5 states) NOTE: Analysis excludes California, as the majority of health insurers do not report their data to the NAIC. Analysis includes standardized plans A-N, policies existing prior to federal standardization, plans in Massachusetts, Minnesota, and Wisconsin that are not part of the federal standardization program, and plans that identified as Medicare Select; excludes plans where number of covered lives was less than 20. Number of Medigap policyholders as of December 31, 2010, as reported in the NAIC data. SOURCE: K. Desmond, T. Rice, and Kaiser Family Foundation analysis of 2010 National Association of Insurance Commissioners (NAIC) Medicare Supplement data. Kaiser Family foundation and Mathematica Policy Research analysis of CMS State/County Market Penetration Files.
Exhibit 3 Distribution of Income of Medicare Beneficiaries, by Source of Supplemental Coverage, 2010 1% 5% 11% 14% 14% 15% 25% 31% 41% 30% 32% 39% 43% $40,000 or more $20,000-$40,000 $10,000-$20,000 42% 37% 44% Less than $10,000 39% 53% 27% 17% 17% 12% 7% 5% All Medicare Beneficiaries Medigap Policyholders Employer Medicare Advantage Medicaid No supp Cov NOTE: Numbers do not sum due to rounding. SOURCE: Kaiser Family Foundation analysis of the CMS Medicare Current Beneficiary Survey Cost and Use File, 2010.
EXHIBIT 4 Exhibit 4 Share of Medicare Beneficiaries with Medigap Plans C and F, 2010 National Average = 12% 12% 13% 20% 46% 21% 8% <1% <1% 17% 12% <1% 6% 36% 18% 16% 12% 13% 29% 15% 37% 34% 8% 13% 11% 19% 18% 9% 10% 9% 15% DC 12% 5% 39% 18% N/A 10% 10% 11% 13% 15% 6% 14% 8% 13% 18% 3% 8% 10% 11% 1% 8% 0%-5% (5 states, DC) 6%-10% (13 states) 11%-15% (16 states) 16%-20% (8 states) 21%-30% (2 states) More than 30% (5 states) SOURCE: K. Desmond, T. Rice, and Kaiser Family Foundation analysis of 2010 National Association of Insurance Commissioners (NAIC) Medicare Supplement data.
Exhibit 5 Share of Medigap Policyholders by All Plan Types, 2010 Plan A 2% MA, MN, and WI 4% Plan B 3% SELECT 9% PreStandardization 8% Plan C 13% Plan D 3% Plans H, I, K, L, M Each 1% or less Plan E 1% Plan J 8% Plan N 2% Plan F 40% Plan G 3% Total Number of Medigap Policyholders, 2010= 9.3 million NOTE: Analysis excludes California, as the majority of health insurers do not report their data to the NAIC. Analysis includes standardized plans A-N, policies existing prior to federal standardization (PreStandardization), and plans in Massachusetts, Minnesota, and Wisconsin that are not part of the federal standardization program; includes plans that identified as Medicare Select; excludes plans where number of covered lives was less than 20. Number of Medigap policyholders as of December 31, 2010, as reported in the NAIC data. SOURCE: K. Desmond, T. Rice, and Kaiser Family Foundation analysis of 2010 National Association of Insurance Commissioners (NAIC) Medicare Supplement data.
Exhibit 6 Distribution of Monthly Medigap Premiums, Plans A J, 2010 $196 $195 $187 $186 $181 $177 $175 90th $169 $169 percentile $140 National average premium 10th percentile A B C D E F G H I J $89 $130 $161 $149 $145 $155 $140 $149 $151 $157 10th percentile $168 $198 $213 $205 $206 $197 $195 $208 $215 $211 90th percentile NOTE: Analysis excludes California, as the majority of health insurers do not report their data to the NAIC. Analysis includes standardized plans A-J; excludes plans K-L because of the small number of policyholders enrolled in these plans; excludes policies existing prior to federal standardization; excludes plans in Massachusetts, Minnesota, and Wisconsin; excludes plans that identified as Medicare Select; excludes plans where number of covered lives was less than 20. SOURCE: K. Desmond, T. Rice, and Kaiser Family Foundation analysis of 2008-2009 National Association of Insurance Commissioners (NAIC) Medicare Supplement data.
Exhibit 7 Average Monthly Medigap Premiums for Plan F, by State, 2010 National Average = $181 $172 $156 $129 $154 $172 $183 $155 $201 $171 $154 $226 $174 $178 $176 $175 $183 $220 $162 $163 $176 $178 $189 $184 $209 $181 $193$186 $171 $178 $158 DC $180 $181 $177 $174 $178 N/A $162 $168 $173 $171 $163 $165 $166 $177 $173 $174 $189 $158 $190 $139 $209 Less than $150 (2 states) $151-$160 (6 states) $161-$170 (7 states) $171-$180 (19 states, DC) $181-$190 (9 states) More than $190 (6 states) NOTE: Analysis excludes California, as the majority of health insurers do not report their data to the NAIC. Analysis includes standardized plan F; excludes plans that identified as Medicare Select; excludes plans where number of covered lives was less than 20. SOURCE: K. Desmond, T. Rice, and Kaiser Family Foundation analysis of 2008-2009 National Association of Insurance Commissioners (NAIC) Medicare Supplement data.
Exhibit 8 Standard Medigap Plan Benefits, 2013 Table A2 MEDIGAP POLICY BENEFITS E1 G2 H1 I1 J1 K3 L3 M4 N4 A B C D F Medicare Part A Coinsurance and all costs after hospital benefits are exhausted Medicare Part B Coinsurance or Copayment for other than preventive services * 50% 75% Blood (first 3 pints) 50% 75% Hospice Care Coinsurance or Copayment (added to Plans A, B, C, D, F, and G in June 2010) 50% 75% Skilled Nursing Facility Care Coinsurance 50% 75% Medicare Part A Deductible 50% 75% 50% Medicare Part B Deductible Medicare Part B Excess Charges Foreign Travel Emergency (Up to Plan Limits)* Out-of-Pocket Limit $4,800 $2,400 NOTES: Check marks indicate 100 percent benefit coverage. Amount in table is the plan s coinsurance amount for each covered benefit after beneficiary pays deductibles or cost-sharing amounts, where applicable. The Affordable Care Act eliminated cost-sharing for preventive benefits rated A or B by the U.S. Preventive Services Task Force, effective 2011. 1After June 1, 2010, Medigap Plans E, H, I, and J are no longer available for purchase by new policyholders; existing policyholders may remain in these plans. 2Benefits for Plan G reflect the standard benefit after June 1, 2010 (Part B excess charges changed from 80% to 100%). 3Medigap Plans K and L available for purchase in 2005. 4Medigap Plans M and N available for purchase after June 1, 2010. *Plan N pays 100% of the Part B coinsurance except up to $20 copayment for office visits and up to $50 for emergency department visits. SOURCE: Centers for Medicare & Medicaid Services, 2013 Guide to Health Insurance, February 2013.