Maternal Thyroid Hormones and Offspring Brain Development: Study Flow and Findings
This study examined the association between maternal thyroid hormones (TSH and FT4) during early pregnancy and offspring brain morphology. A flowchart illustrates participant enrollment and exclusion, with subsequent MRI analyses on child brain volumes. Results show significant associations between maternal thyroid hormone levels and offspring gray matter volume, with interactions based on gestational age at blood sampling. Adjusted for various factors, the findings provide insights into how maternal thyroid function may impact child brain development.

Download Presentation

Please find below an Image/Link to download the presentation.
The content on the website is provided AS IS for your information and personal use only. It may not be sold, licensed, or shared on other websites without obtaining consent from the author.If you encounter any issues during the download, it is possible that the publisher has removed the file from their server.
You are allowed to download the files provided on this website for personal or commercial use, subject to the condition that they are used lawfully. All files are the property of their respective owners.
The content on the website is provided AS IS for your information and personal use only. It may not be sold, licensed, or shared on other websites without obtaining consent from the author.
E N D
Presentation Transcript
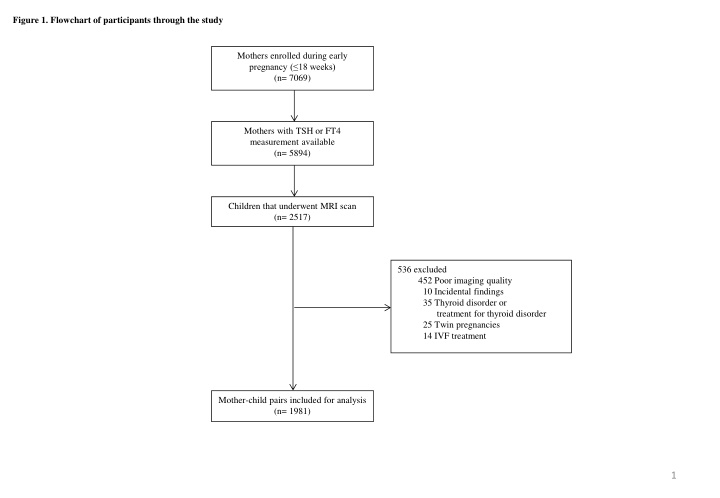
Figure 1. Flowchart of participants through the study Mothers enrolled during early pregnancy ( 18 weeks) (n= 7069) Mothers with TSH or FT4 measurement available (n= 5894) Children that underwent MRI scan (n= 2517) 536 excluded 452 Poor imaging quality 10 Incidental findings 35 Thyroid disorder or treatment for thyroid disorder 25 Twin pregnancies 14 IVF treatment Mother-child pairs included for analysis (n= 1981) 1
Figure 2. Association of maternal thyroid stimulating hormone and free thyroxine with offspring brain morphology 770 770 Mean total gray matter volume (cm3) Mean total gray matter volume (cm3) 765 765 760 760 755 755 750 750 P= 0 007 P= 0 75 0 1 2 3 4 10 15 20 25 TSH (mU/L) FT4 (pmol/L) 590 590 Mean cortex volume (cm3) Mean cortex volume (cm3) 585 585 580 580 575 575 P= 0 33 P= 0 022 20 25 10 15 0 1 2 3 4 FT4 (pmol/L) TSH (mU/L) Plots show the association of maternal thyroid stimulating hormone (TSH) in mU/L and free thyroxine (FT4) in pmol/L with total gray matter volume and cortical gray matter volume in cm3. Analyses were adjusted for gestational age at blood sampling, maternal age, ethnicity, education level, smoking TPOAb positivity (>60 IU/ml) and child sex, age at MRI, and total intracranial volume. 2
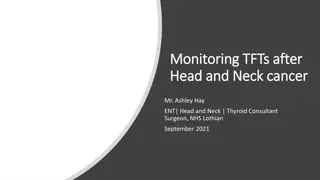
Figure 3. The association of maternal TSH with child gray matter volume or cortical gray matter volume stratified by gestational age at blood sampling 1 2 3 4 770 Mean total gray matter volume (cm3) 760 750 740 730 770 760 750 740 730 1 2 3 4 1 2 3 4 TSH (mU/L) P for interaction = 0 053 Plots show the interaction between maternal thyroid stimulating hormone (TSH) in mU/L and gestational age at blood sampling for total gray matter volume and cortical gray matter volume. Analyses were adjusted for gestational age at blood sampling, maternal age, ethnicity, education level, smoking, TPOAb positivity (>60 IU/ml) and child sex, age at MRI, and total intracranial volume. 3
Figure 3. The association of maternal TSH with child gray matter volume or cortical gray matter volume stratified by gestational age at blood sampling 1 2 3 4 590 580 Mean cortex volume (cm3) 570 560 590 580 570 560 1 2 3 4 1 2 3 4 TSH (mU/L) P for interaction = 0 086 Plots show the interaction between maternal thyroid stimulating hormone (TSH) in mU/L and gestational age at blood sampling for total gray matter volume and cortical gray matter volume. Analyses were adjusted for gestational age at blood sampling, maternal age, ethnicity, education level, smoking, TPOAb positivity (>60 IU/ml) and child sex, age at MRI, and total intracranial volume. 4