Marginal Propensity to Consume and Save
Marginal Propensity to Consume (MPC) and Marginal Propensity to Save (MPS) measure the ratios of change in consumption and saving to change in disposable income respectively. The relationship between MPC and MPS shows that they equal 1 when combined, with the remainder being saved. The multiplier effect highlights how economic agents spending money creates a cycle of economic growth. The spending multiplier formula is used to determine the impact of individual spending on economic growth.

Download Presentation

Please find below an Image/Link to download the presentation.
The content on the website is provided AS IS for your information and personal use only. It may not be sold, licensed, or shared on other websites without obtaining consent from the author.If you encounter any issues during the download, it is possible that the publisher has removed the file from their server.
You are allowed to download the files provided on this website for personal or commercial use, subject to the condition that they are used lawfully. All files are the property of their respective owners.
The content on the website is provided AS IS for your information and personal use only. It may not be sold, licensed, or shared on other websites without obtaining consent from the author.
E N D
Presentation Transcript
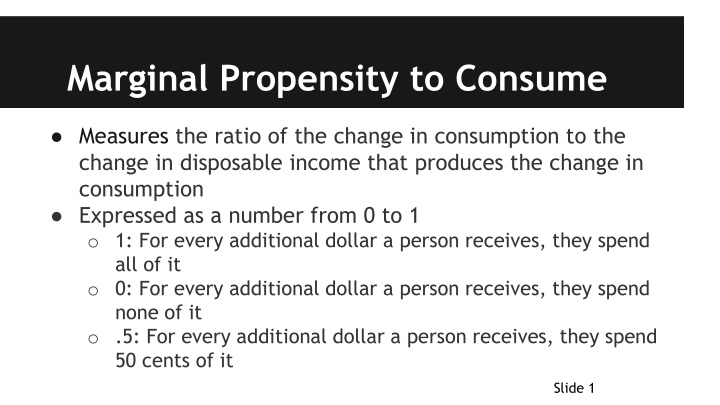
Marginal Propensity to Consume Measures the ratio of the change in consumption to the change in disposable income that produces the change in consumption Expressed as a number from 0 to 1 o 1: For every additional dollar a person receives, they spend all of it o 0: For every additional dollar a person receives, they spend none of it o .5: For every additional dollar a person receives, they spend 50 cents of it Slide 1
Marginal Propensity to Save Measures the the ratio of the change in saving to the change in disposable income that produces the change in saving Expressed as a number from 0 to 1 o 0: For every additional dollar a person receives, they save none of it o 1: For every additional dollar a person receives, they save all of it o .8: For every additional dollar a person receives, they save 80 cents of it Slide 2
Relationship Between MPC and MPS When a person receives a dollar, they can either spend it or save it Thus, the marginal propensity to consume and marginal propensity to save will equal 1 when added together o If the marginal propensity to consume is .8, 80 cents out of every additional dollar is spent o This leaves 20 cents to be saved 1 - MPC = MPS Slide 3
Multiplier Effect Economic Agent Spends Money Business Spends Money Individual Spends Money Money flows to business Money flows to individual Money flows to business Individual Spends Money Business Spends Money Business Spends Money Money flows to individual Money flows to business Slide 4
Spending Multiplier Spending multiplier o Used when an economic agent spends money in the economy o 1/1-MPC or 1/MPS Example: Individual spends $500. MPC of .75. How much economic growth will the spending create? 1/1-.75 = 4 4 X $500 = $2,000 of additional economic growth Slide 5