Maine Workforce and Population Trends Analysis 2014-2024
Maine's workforce and population outlook from 2014 to 2024 reveals a decline in births, resulting in an aging population and workforce imbalance. The state faces challenges due to low birth rates, negative natural population change, and minimal net migration, impacting labor force growth and total population stability. The projection suggests a rise in the senior population and a decline in prime-age workers, potentially affecting economic dynamics in the coming decade.
Download Presentation

Please find below an Image/Link to download the presentation.
The content on the website is provided AS IS for your information and personal use only. It may not be sold, licensed, or shared on other websites without obtaining consent from the author.If you encounter any issues during the download, it is possible that the publisher has removed the file from their server.
You are allowed to download the files provided on this website for personal or commercial use, subject to the condition that they are used lawfully. All files are the property of their respective owners.
The content on the website is provided AS IS for your information and personal use only. It may not be sold, licensed, or shared on other websites without obtaining consent from the author.
E N D
Presentation Transcript
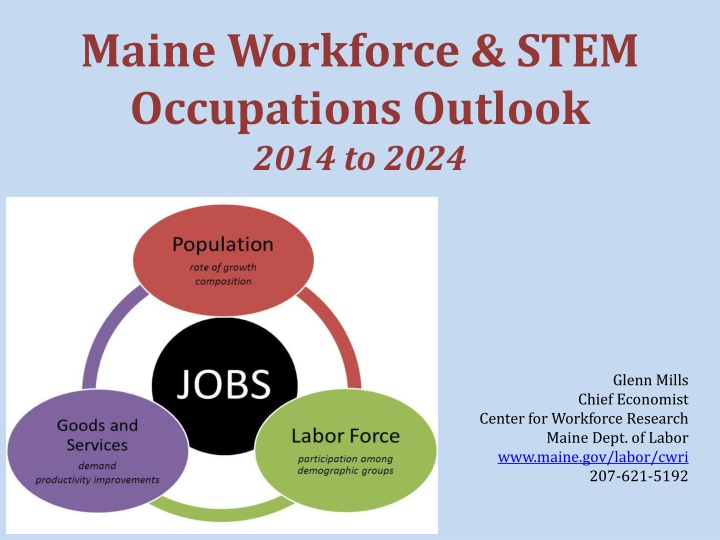
Maine Workforce & STEM Occupations Outlook 2014 to 2024 Glenn Mills Chief Economist Center for Workforce Research Maine Dept. of Labor www.maine.gov/labor/cwri 207-621-5192
Labor Force Trends & Outlook
The number of births has declined precipitously 24,000 Natural population change the difference between births and deaths has been slightly negative since 2011, a pattern that is expected to continue over the next decade. Net migration the difference between the number moving into and out of the state was positive most years from the 1970s to early 2000s, but has only been just enough to offset the natural decline since 2007. Births Deaths Births and Deaths per Year 20,000 16,000 12,000 8,000 1950 1960 1965 1970 1975 1985 1990 1995 2000 2005 2010 2015 1955 1980
The decline in births caused an imbalance in our population structure. Maine has a very high share of people in their 50s and 60s headed toward retirement and low share of kids to replace them in the labor force. 2% Percent of Population by Age, 2014 The large gap between the number of people who will retire and the number of young people who will enter the workforce will put significant downward pressure on the size labor force over the next two decades. 1% U.S. Maine 0% 0 5 10 15 20 25 30 35 40 45 50 55 60 65 70 75 80
The total population has been nearly unchanged since 2008 due to the combination of no natural increase and very little net migration 1,400,000 From the 1970s to early 2000s, the combination of natural increase and positive net migration the difference between those moving into and out of the state caused consistent population growth. Since 2007, net migration has been just enough to offset the small natural decline. If net migration does not pick up, the total population is likely to gradually decline. 1,300,000 Population 1,200,000 1,100,000 1,000,000 900,000 1950 1955 1960 1965 1970 1975 1980 1985 1990 1995 2000 2005 2010 2015 2020
The senior population is expected to rise sharply as the number of prime-age workers declines nearly as much 75,000 Projected Population Change, 2014 to 2024 Changes in the size of the labor force are driven not only by changes in the size of the population, but also its composition. A rising share of the population is advancing beyond their peak years of labor force attachment. 50,000 25,000 0 -25,000 -50,000 16-19 20-24 25-34 35-44 45-54 55-64 65+
The senior population is expected to rise sharply as the number of prime-age workers declines nearly as much 90% Changes in the size of the labor force are driven not only by changes in the size of the population, but also its composition. Labor force participation rates are expected to rise in all age groups, but the total participation rate will decline because a rising share of population is advancing to retirement. 75,000 Projected Population Change, 2014 to 2024 80% Labor Force Participation Rates 50,000 70% 60% 25,000 50% 0 40% Change -25,000 2014 Participation Rate 30% 2024 Participation Rate -50,000 20% 16-19 20-24 25-34 35-44 45-54 55-64 65+
The labor force is expected to decline through 2024 as a result of these population trends 24% Rapid labor force growth from the mid 1960s through 1980s was driven by thousands of baby boomers going to work. Over the next two decades more baby boomers are expected to leave the labor force than the number of young people who will begin working, causing the size of the labor force to decline. Change in Civilian Labor Force by Decade 20% 16% 12% 8% 4% 0% -4% 1954-64 1964-74 1974-84 1984-94 1994-04 2004-14 2014-24
Industry Job Trends & Outlook
Employment has long been shifting from businesses that produce goods to those that provide services Goods-Producing Service-Providing 56% 44% 32% 68% 18% 1950 13% 82% 1975 87% 2000 2024, projected
Three-quarters of jobs are in healthcare, government, retail, professional services, hospitality, or manufacturing With 101,100 jobs, healthcare and social assistance was the largest sector in Maine in 2014. Government (federal, state, and local, including public schools, community college, and university systems) was second with 95,500 jobs. Retail trade (81,700 jobs), professional and business services (63,500), leisure and hospitality (63,200), and manufacturing (50,200) were the next largest. Leisure & Hospitality 11% Manufacturing 9% Professional & Business Svcs. 11% Financial Activities 5% Construction 4% All Other 23% Wholesale Trade 3% Other Services 3% Transport & Utilities 3% Education 2% Information 1% Natural Resources 1% Retail Trade 14% Government 16% Healthcare & Soc. Assistance 17%
Job gains are expected to be substantial in three sectors, with large losses in two, and little change in others The shifting age structure of the population is a primary factor driving job gains in healthcare and losses in government, mostly in public education. Professional services and hospitality are expected to continue to add jobs and the long- term downward job trend in manufacturing and information is also expected to persist. 10,000 Projected Job Change by Sector 7,500 5,000 2014 to 2024 2,500 0 -2,500 -5,000 -7,500 Other Services Utilities Financial Activities Educational Svcs Construction Information Manufacturing Retail Trade Professional/Business Svcs Wholesale Trade Government Leisure & Hospitality Natural Resources & Mining Health Care/Social Assistance Transportation & Warehousing
Occupational Job Trends & Outlook
The occupational structure of employment has shifted away from blue-collar jobs 1950 2014 Blue collar Mgmt, pro/tech Office, sales, service
STEM Occupations Job Trends & Outlook
Two approaches to defining STEM By academic course of study or degree By occupation of work Some who have an academic background in a STEM field do not work in an associated field Some working in a STEM occupation do not have an academic background in that discipline We use the occupation of work approach to look at the number of jobs and the outlook for growth
STEM occupations The U.S. Bureau of Labor Statistics designates 184 occupations as STEM The O*Net Consortium designates 167 occupations as STEM We use a combined list, totaling 197 occupations
Jobs in STEM occupations are expected to increase by about 5,400 to 115,900 in 2024 120,000 Of 197 STEM occupations, jobs in 120 are expected increase at a faster rate than the average, but jobs in 77 occupations are projected to increase at or below the average or lose jobs. 100,000 Jobs 80,000 60,000 40,000 2014 2024
In contrast, the number of jobs in non-STEM occupations is not expected to change much 6,000 Projected Job Change, 2014 to 2024 4,000 2,000 0 STEM Occupations Non-STEM Occupations -2,000
And the share of jobs in STEM occupations is only expected to rise slightly (from 16.7% to 17.4% of all jobs) STEM Occupations Non-STEM Occupations 600,000 500,000 400,000 Jobs 300,000 200,000 100,000 0 2014 2024
Growth is the source of only 12% of job openings. Most openings are to replace those who leave the labor force. About 17% of openings are expected in STEM occupations. STEM Non-STEM In STEM occupations, about 22% of openings will be due to growth; in non-STEM occupations, just 9% of openings will be due to growth.
STEM jobs are found in 15 of 22 broad occupational groups. The largest share are healthcare practitioners & technicians. 100,000 Jobs by Occupational Group in 2014 STEM Jobs All Jobs 75,000 50,000 25,000 0
39% of STEM jobs are in health practitioner/technician, 12% in management, 10% in computer/mathematics, 9% in business/finance, and 9% in architecture/engineering occupations Jobs by Occupational Group in 2014 40,000 STEM occupations are not a homogeneous group; education and skill requirements, wage levels, and job outlook differ greatly 30,000 20,000 10,000 0 Healthcare Installation, Maintenance & Management Legal Production Healthcare Support Personal Care & Service Construction & Extraction Community & Social Service Farming, Fishing & Forestry Sales Related Protective Services Office/Admin Support Food Preperation/Serving Transportation/Material Moving Arts/Design/Entertainment/Media Building/Grounds Maintenance Life/Physical/Social Science Education, Training & Library Business & Financial Operations Computer & Mathematical Architecture & Engineering
There is a wide range of education requirements among STEM occupations, though 75% require an associate s degree or higher 250,000 Jobs by Education Requirement in 2014 STEM jobs 200,000 All Jobs 150,000 100,000 50,000 0
About half of jobs in STEM occupations require a Bachelor s degree, 15% require an advanced degree, and nearly 1/3 do not require a degree 50,000 Jobs by Education Requirement in 2014 40,000 30,000 20,000 10,000 0
The average hourly wage of jobs in STEM occupations is 84% higher than for jobs in non-STEM occupations The average is skewed by high wages of Physicians and other health practitioners, which comprise the 10 highest paying STEM occupations. Average wages for 28 STEM occupations are below the average for all occupations. $30 Average Hourly Wage in 2015 $20 $10 $- STEM Jobs Non-STEM Jobs
The highest average wages are in healthcare occupations $40 $30 Average Hourly Wage in 2015 $20 $10 $- Healthcare Practitioner/Technition All Other STEM Jobs
Within occupational groups, average wages are similar for STEM and non-STEM jobs with some exceptions STEM Jobs Non-STEM Jobs Average Hourly Wage in 2015 $40 $30 $20 $10 $0
STEM jobs offer higher average wages no matter what the education requirement for the occupation. Differentials generally are larger at higher levels of required education $75 Average Hourly Wage in 2015 STEM Jobs Non-STEM jobs $60 $45 $30 $15 $-
Not all occupations expected to increase rapidly will have many openings (20 STEM occupations with fastest rate of growth) Jobs Projected Change Average Annual Openings 2015 Average Wage* Occupation Typical Education Replace- ment 2014 2024 Net Percent Growth Total Biomedical Engineers 127 198 71 55.9% 7 3 10 $40.92 Bachelor's degree Statisticians 74 95 21 28.4% 2 1 3 Master's degree $40.60 Operations Research Analysts 245 307 62 25.3% 6 4 10 $33.59 Bachelor's degree Nurse Practitioners 1,175 1,468 293 24.9% 29 28 57 $46.44 Master's degree Cartographers and Photogrammetrists 74 90 16 21.6% 2 2 4 $26.69 Bachelor's degree Forensic Science Technicians 46 55 9 19.6% 1 2 3 $21.17 Bachelor's degree Physician Assistants 949 1,131 182 19.2% 18 21 39 $49.30 Master's degree Cardiovascular Technologists and Technicians 220 261 41 18.6% 4 4 8 $27.66 Associate's degree Atmospheric and Space Scientists 71 84 13 18.3% 1 1 2 Bachelor's degree $43.37 Diagnostic Medical Sonographers 246 291 45 18.3% 4 5 9 $37.05 Associate's degree Biochemists and Biophysicists 104 123 19 18.3% 2 3 5 $33.73 Doctoral or professional degree Orthotists and Prosthetists 41 48 7 17.1% 1 0 1 $28.88 Master's degree Web Developers 548 641 93 17.0% 9 7 16 $26.09 Associate's degree Physical Therapists 1,332 1,555 223 16.7% 22 36 58 $36.51 Doctoral or professional degree Software Developers, Applications 1,498 1,737 239 16.0% 24 21 45 $41.51 Bachelor's degree Computer Systems Analysts 1,615 1,870 255 15.8% 26 21 47 $37.57 Bachelor's degree Software Developers, Systems Software 366 422 56 15.3% 6 5 11 $47.57 Bachelor's degree Clinical, Counseling, and School Psychologists 405 465 60 14.8% 6 9 15 $41.43 Doctoral or professional degree Occupational Therapists 963 1,100 137 14.2% 14 19 33 $31.25 Master's degree Veterinary Technologists and Technicians 715 812 97 13.6% 10 7 17 $16.05 Associate's degree
Not all occupations with large numbers of expected openings are growing (20 STEM occupations with largest number of openings) Jobs Projected Change Average Annual Openings 2015 Average Wage* Occupation Typical Education Replace- ment 2014 2024 Net Percent Growth Total Registered Nurses 14,617 16,219 1,602 11.0% 160 345 505 $30.92 Bachelor's degree Accountants and Auditors 4,809 5,120 311 6.5% 31 128 159 $28.94 Bachelor's degree 3,952 4,150 198 5.0% 20 117 137 $15.48 High school diploma or equivalent First-Line Supervisors of Food Preparation and Serving Workers Automotive Service Technicians and Mechanics 4,283 4,209 -74 -1.7% 0 115 115 $18.00 Postsecondary non-degree award Physicians and Surgeons, All Other 2,583 2,805 222 8.6% 22 70 92 $101.33 Doctoral or professional degree Medical and Health Services Managers 1,885 2,051 166 8.8% 17 48 65 $45.99 Bachelor's degree Physical Therapists 1,332 1,555 223 16.7% 22 36 58 $36.51 Doctoral or professional degree Nurse Practitioners 1,175 1,468 293 24.9% 29 28 57 $46.44 Master's degree Farmers, Ranchers, and Other Agricultural Managers 3,159 3,003 -156 -4.9% 0 54 54 $26.37 High school diploma or equivalent Cooks, Institution and Cafeteria 1,751 1,797 46 2.6% 5 46 51 $13.16 No formal educational credential Managers, All Other 2,324 2,301 -23 -1.0% 0 51 51 Bachelor's degree $45.90 Logging Equipment Operators 2,059 1,964 -95 -4.6% 0 49 49 $17.70 High school diploma or equivalent Computer Systems Analysts 1,615 1,870 255 15.8% 26 21 47 $37.57 Bachelor's degree Construction Managers 3,309 3,238 -71 -2.2% 0 46 46 $39.74 Bachelor's degree Software Developers, Applications 1,498 1,737 239 16.0% 24 21 45 $41.51 Bachelor's degree Licensed Practical and Licensed Vocational Nurses 1,340 1,403 63 4.7% 6 38 44 $20.39 Postsecondary non-degree award Business Operations Specialists, All Other 2,759 2,862 103 3.7% 10 33 43 $29.47 Bachelor's degree Physician Assistants 949 1,131 182 19.2% 18 21 39 $49.30 Master's degree Computer User Support Specialists 1,951 2,089 138 7.1% 14 25 39 $21.65 Some college, no degree Emergency Medical Technicians and Paramedics 1,725 1,839 114 6.6% 11 28 39 $15.91 Postsecondary non-degree award


