Local Government Tax Revenues in Ohio
Local Government Tax Revenues
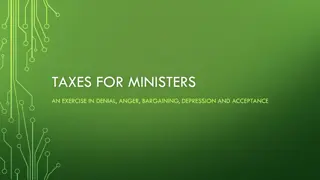
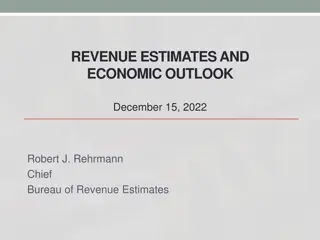
Property tax revenues reach new high in 2020
Net property taxes collectible for tax year
(TY) 2020 reached an all-time high of
$18.3 billion, an increase of 4.6% ($806
million) from 2019, which was the previous
peak year.
From 2010 to 2020, net taxes collectible on
real property rose 27%, while taxes on
tangible personal property (TPP) increased
170%. The TPP growth was related to new gas
pipelines placed into service in Ohio, largely
due to shale drilling.
The TPP tax was phased out in 2009 for
general business and in 2011 for telephone
and interexchange telecommunications
companies. Public utilities (including certain
pipeline operators) remain subject to the tax.
Property taxes in Ohio fund local
governments, except for a small deduction
retained by the state for costs of tax
administration. About $2 of every $3 in
property taxes collected go to school districts.
Sources: Ohio Department of Taxation;
Legislative Service Commission
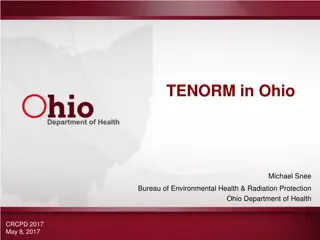
Ohio’s local governments rely heavily
on property taxes
In 2019, local tax revenue in Ohio totaled $29.12 billion,
an increase of $1.10 billion (3.9%) from 2018.
Property taxes charged and payable in 2019 amounted
to $18.42 billion. Receipts from municipal and school
district income taxes and the local share of the estate tax
were $6.37 billion. Sales and use taxes provided
$2.69 billion. Other taxes (casino, admission, alcohol,
cigarette, lodging, motor vehicle fuel, and motor vehicle
license) generated $1.48 billion.
The state distributes a portion of CAT receipts to local
governments to replace tangible personal property (TPP) tax
revenue that was reduced primarily due to elimination of the
tax on general business TPP. In 2019, the replacement
payments amounted to $0.16 billion, or 0.6% of total local tax
revenue, down from 0.7% in 2018. The payments have
decreased steadily over time due to scheduled phasing out of
reimbursements.
Sources: Ohio Department of Taxation; Ohio Department of Public Safety
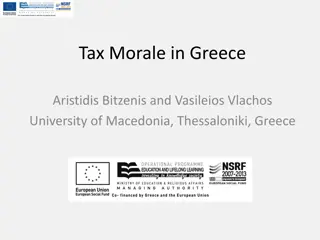
Local tax revenue growth averaged 2.4% per
year over recent decade
Over the decade ending in 2019, total local tax revenue grew at an average of 2.4% per year. Annual growth rates were higher in the mid-2000s, slowed in
2008, 2009, and 2011, then grew modestly during the last eight years. Tax revenue increased by 2.5% and 3.9% in 2018 and 2019, respectively.
From 2009 to 2019, revenue growth was fastest in the “other taxes” category with average growth of 5.2% per year, followed by the sales and use tax
category, averaging 5.0% annually. Income and estate taxes grew at an average of 3.6% annually, slowed by falling estate tax revenue due to elimination of
that tax. Property tax growth averaged 2.4% per year. TPP reimbursement payments from the CAT fell by 18.0% per year.
The main drivers behind growth in “other taxes” over the decade were the establishment of the casino tax, from which revenue began in 2012, and an
increase in motor fuel tax rates from 28¢ per gallon for both gasoline and diesel fuel to 38.5¢ and 47¢ per gallon, respectively, in 2019.
Sources: Ohio Department of Taxation; Ohio Department of Public Safety
Local governments in Ohio rely heavily on property taxes as a significant source of revenue, with property tax revenues reaching a new high in 2020. Net property taxes collectible increased, particularly for tangible personal property due to factors like shale drilling and new gas pipelines. The state distributes a portion of Commercial Activity Tax receipts to replace tangible personal property tax revenue. Over the past decade, local tax revenue growth in Ohio averaged 2.4% annually, with varying growth rates across different tax categories.

Download Presentation

Please find below an Image/Link to download the presentation.
The content on the website is provided AS IS for your information and personal use only. It may not be sold, licensed, or shared on other websites without obtaining consent from the author.If you encounter any issues during the download, it is possible that the publisher has removed the file from their server.
You are allowed to download the files provided on this website for personal or commercial use, subject to the condition that they are used lawfully. All files are the property of their respective owners.
The content on the website is provided AS IS for your information and personal use only. It may not be sold, licensed, or shared on other websites without obtaining consent from the author.
E N D
Presentation Transcript
Local Government Tax Revenues Legislative Budget Office lsc.ohio.gov lsc.ohio.gov
Property tax revenues reach new high in 2020 Net Property Taxes Collectible by Property Type Net property taxes collectible for tax year (TY) 2020 reached an all-time high of $18.3 billion, an increase of 4.6% ($806 million) from 2019, which was the previous peak year. From 2010 to 2020, net taxes collectible on real property rose 27%, while taxes on tangible personal property (TPP) increased 170%. The TPP growth was related to new gas pipelines placed into service in Ohio, largely due to shale drilling. The TPP tax was phased out in 2009 for general business and in 2011 for telephone and interexchange telecommunications companies. Public utilities (including certain pipeline operators) remain subject to the tax. Property taxes in Ohio fund local governments, except for a small deduction retained by the state for costs of tax administration. About $2 of every $3 in property taxes collected go to school districts. $20 $18 $2.1 $2.0 $16 $1.5 $1.3 $1.3 $1.1 $1.0 $14 $0.9 $0.9 $0.8 $0.8 $12 Billions $10 $16.2 $8 $15.6 $15.3 $14.8 $14.4 $13.9 $13.7 $13.4 $13.0 $12.9 $12.8 $6 $4 $2 $0 2010 2011 2012 2013 2014 2015 2016 2017 2018 2019 2020 Sources: Ohio Department of Taxation; Legislative Service Commission Real Tangible Personal lsc.ohio.gov lsc.ohio.gov Legislative Budget Office
Ohios local governments rely heavily on property taxes Ohio s Local Tax Revenue by Source, 2019 In 2019, local tax revenue in Ohio totaled $29.12 billion, an increase of $1.10 billion (3.9%) from 2018. Property taxes charged and payable in 2019 amounted to $18.42 billion. Receipts from municipal and school district income taxes and the local share of the estate tax were $6.37 billion. Sales and use taxes provided $2.69 billion. Other taxes (casino, admission, alcohol, cigarette, lodging, motor vehicle fuel, and motor vehicle license) generated $1.48 billion. Sales and Use Taxes 9.2% Income and Estate Taxes 21.9% Commercial Activity Tax (CAT) 0.6% Other Taxes 5.1% Total: $29.12 billion The state distributes a portion of CAT receipts to local governments to replace tangible personal property (TPP) tax revenue that was reduced primarily due to elimination of the tax on general business TPP. In 2019, the replacement payments amounted to $0.16 billion, or 0.6% of total local tax revenue, down from 0.7% in 2018. The payments have decreased steadily over time due to scheduled phasing out of reimbursements. Property Taxes 63.3% Sources: Ohio Department of Taxation; Ohio Department of Public Safety lsc.ohio.gov lsc.ohio.gov Legislative Budget Office
Local tax revenue growth averaged 2.4% per year over recent decade Ohio s Local Tax Revenue Growth, 2005-2019 7.0% 7.0% 6.4% 6.3% 6.0% 5.0% 3.9% 3.6% 4.0% 2.8% 2.7% 2.5% 3.0% 2.2% 2.2% 2.2% 2.0% 2.0% 1.0% 0.3% 0.0% 0.0% -0.4% 2009 -1.0% 2005 2006 2007 2008 2010 2011 2012 2013 2014 2015 2016 2017 2018 2019 Sources: Ohio Department of Taxation; Ohio Department of Public Safety Over the decade ending in 2019, total local tax revenue grew at an average of 2.4% per year. Annual growth rates were higher in the mid-2000s, slowed in 2008, 2009, and 2011, then grew modestly during the last eight years. Tax revenue increased by 2.5% and 3.9% in 2018 and 2019, respectively. From 2009 to 2019, revenue growth was fastest in the other taxes category with average growth of 5.2% per year, followed by the sales and use tax category, averaging 5.0% annually. Income and estate taxes grew at an average of 3.6% annually, slowed by falling estate tax revenue due to elimination of that tax. Property tax growth averaged 2.4% per year. TPP reimbursement payments from the CAT fell by 18.0% per year. The main drivers behind growth in other taxes over the decade were the establishment of the casino tax, from which revenue began in 2012, and an increase in motor fuel tax rates from 28 per gallon for both gasoline and diesel fuel to 38.5 and 47 per gallon, respectively, in 2019. lsc.ohio.gov lsc.ohio.gov Legislative Budget Office


![Town of [Town Name] Real Estate Tax Rates and FY 2024 Budget Summary](/thumb/62211/town-of-town-name-real-estate-tax-rates-and-fy-2024-budget-summary.jpg)