Livestock Value Chain Selection Process and Criteria
Learn about the step-by-step process of selecting livestock value chains in Ethiopia, including geographical targeting, stakeholder consultations, data gathering, and site mobilization. Understand the rationale behind selecting potential livestock value chains based on growth opportunities, pro-poor potential, and supply constraints.

Download Presentation

Please find below an Image/Link to download the presentation.
The content on the website is provided AS IS for your information and personal use only. It may not be sold, licensed, or shared on other websites without obtaining consent from the author. If you encounter any issues during the download, it is possible that the publisher has removed the file from their server.
You are allowed to download the files provided on this website for personal or commercial use, subject to the condition that they are used lawfully. All files are the property of their respective owners.
The content on the website is provided AS IS for your information and personal use only. It may not be sold, licensed, or shared on other websites without obtaining consent from the author.
E N D
Presentation Transcript
CGIAR Research Program on Livestock and Fish Targeting sheep and goat value chains for Ethiopia Jeanette van de Steeg, Jane Poole, Barbara Rischkowsky, Aynalem Haile, Tadelle Dessie Ethiopian Small Ruminant Value Chain Consultative Meeting Addis Abeba, Ethiopia, 6 July 2012
Site selection proces Step 1: Geographical targeting - identification of potential regions/districts for selection using GIS Step 2: Stakeholder consultations (ground- truthing of Step 1 and define soft criteria to be used) Step 3: Minimum checklist to gather data for more specific site selection Step 4: Analysis of Step 1 3 and Site selection Step 5: Mobilization and activities in selected sites can now start
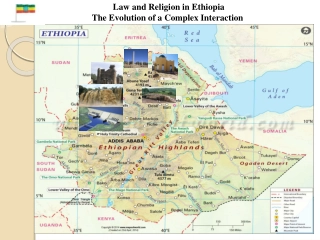
Step 1: Geographical targeting using GIS - identification of potential regions/districts for selection
Rationale for selecting potential livestock value chains 1. Growth and market opportunity: Is there evidence of increasing demand for the commodity, locally or regionally? What is the importance of the commodity for people s livelihoods? 2. Pro-poor potential: How will the poor be involved? Is there evidence they can play a significant role in increased production, or being employed in value chain activities, or will benefit from increased consumption? 3. Researchable supply constraints: Are there supply constraints, such as large productivity gaps or transactions costs for which research may be able to provide solutions, and would create production and welfare gains?
Translating rationale into spatial criteria Growth and market opportunity: sheep density, agroecological potential (number of growing days, prod systems ), market linkage (distance/time to next market ), supply deficit Pro-poor potential: number of poor sheep and goat keepers, number of poor people or proportion of poor people Supply constraints (scope for improvement): low productivity or surplus-deficit in meat production
Decisions to be taken in step 1 Which criteria are most important? Which spatial data are most suitable to express the criteria? How reliable are the existing datasets? What thresholds should be applied for a certain country/commodity?
Geographical targeting with GIS Agro-ecological conditions High to medium poverty High sheep and goat densities Market access/domains
Agro-ecological conditions Rangeland based Mixed rainfed Mixed irrigated Figure 1: Distribution of livestock production systems in Ethiopia (derived from Robinson et al., 2011)
Agro-ecological conditions Table 1: Surface area of production systems in Ethiopia (derived from Robinson et al., 2011) Production system Area Percentage (%) 45.4 1.4 1.4 18.3 4.8 25.2 0.5 3.0 Rangeland based, (Hyper-) Arid/Semi-arid (LGA) 498,100 Rangeland based, Humid/Sub-humid (LGH) 15,100 Rangeland based, Temperate/Tropical highlands (LGT) 15,100 Mixed, (Hyper-) Arid/Semi-arid (MRA) 200,100 Mixed, Humid/Sub-humid (MRH) 52,600 Mixed, Temperate/Tropical highlands (MRT) 276,700 Urban 5,100 Other 33,300 Focus on: Rangeland based, Arid/Semi-arid (LGA) Mixed, Arid/Semi-arid (MRA) Mixed, Temperate/Tropical highlands (MRT)
Agro-ecological conditions Figure 2: Areas with representative farming systems (LGA, MRA and MRT) for Ethiopia (in green, all other areas in grey)
Population and poverty Figure 3: Distribution of population density in Ethiopia (derived from CIESIN, 2010)
Population and poverty Table 2: Total population by regions, and number of people living of less than 1.25 and 2$/day (derived from CIESIN, 2011 and Wood e al, 2010) Total Poor people living <1.25$/day Total number (1000) 1,985 1,202 6,028 266 7,756 947 88 34 774 5,447 65 Poor people living <2$/day Total number (1000) 3,850 2,428 12,389 537 15,513 1,926 176 71 1,573 11,141 130 Region population (1000) 3,850 2,453 16,728 569 22,152 2,875 304 155 2,496 12,386 148 % of poor people 51.6 49.0 36.0 46.7 35.0 32.9 29.0 22.0 31.0 44.0 43.9 % of poor people 100.0 99.0 74.1 94.3 70.0 67.0 58.0 46.0 63.0 89.9 87.7 Tigray Afar Amhara Benishangul Gumuz Oromia Somali Dire Dawa Harari Addis Ababa SNNP Gambella
Population and poverty Figure 4b: Distribution of the number of people living on less than $1.25 per day (derived from Wood et al., 2010)
Population and poverty Figure 5b: Distribution of the proportion of poor people of total population
Population and poverty Figure 6a: Areas with high proportion of poor people, >40% (1.25$/day) (in purple, all other areas in pink)
Sheep and goat densities Table 3: Average densities of cattle, goat, pigs and sheep by production system (head/km2) (derived from Wint & Robinson, 2007) Livestock Production system Cattle Goat Sheep Rangeland based, (Hyper-) Arid/Semi-arid (LGA) 7.1 3.0 1.9 Rangeland based, Humid/Sub-humid (LGH) 9.1 3.6 2.8 Rangeland based, Temperate/Tropical highlands (LGT) 11.5 3.6 2.5 Mixed, (Hyper-) Arid/Semi-arid (MRA) 32.4 13.1 10.5 Mixed, Humid/Sub-humid (MRH) 46.0 9.5 12.3 Mixed, Temperate/Tropical highlands (MRT) 64.2 12.3 22.9 Urban 52.5 14.1 21.4 Other 30.8 4.3 12.0
Travel time to cities larger than 100,000 people Goat densities Figure 7: Distribution of goat densities
Goat densities Figure 8: Areas with high densities of goats (in brown, all other areas in yellow)
Sheep densities Figure 9: Distribution of sheep densities
Sheep densities Figure 10: Areas with high densities of sheep (in brown, all other areas in yellow)
Market access Figure 11: Travel time to the nearest town of 100,000 people (Nelson, 2008)
Market access Figure 12: Areas with relative good market access , in less than 8 hours to cities with population of 100,000 (in red, all other areas in yellow)
Spatial targeting of suitable areas Combining the various layers
Spatial targeting of suitable areas Figure 13: Areas with representative production systems, high poverty levels and and high sheep or goat densities (coloured, all other areas in grey)
Spatial targeting of suitable areas - not considering poverty level Figure 14: Areas with representative production systems and high sheep or goat densities (coloured, all other areas in grey)
Step 2: Stakeholder consultation - Revise/validate step 1 - Define and apply soft criteria - Propose eligible districts that match with agreed criteria
Examples of soft selection criteria for sheep ad goat value chains Synergy with previous and ongoing research and development efforts by CG and/or national system Priorities of the government and other national stakeholders, e.g. example AGP woredas Potential for successful implementation and impact based on in-depth knowledge of conditions and development experiences Presence and interest of research (and extension) system Regional representation Reasonably good information available on breeds and production systems as base for research and development Others ..