Lipophilicity and Translocation of Chemicals in Plants: Exploring the Relationship Between Log.D and TSCF
A study investigates the correlation between the lipophilicity of chemicals and their translocation in intact plants. The focus is on the relationship between log.D values and the Transpiration Stream Concentration Factor (TSCF). Various curves are proposed to describe this relationship, aiming to reduce observed variability and establish a mathematical model. The research aims to enhance understanding of root uptake mechanisms based on chemical properties.
Download Presentation

Please find below an Image/Link to download the presentation.
The content on the website is provided AS IS for your information and personal use only. It may not be sold, licensed, or shared on other websites without obtaining consent from the author.If you encounter any issues during the download, it is possible that the publisher has removed the file from their server.
You are allowed to download the files provided on this website for personal or commercial use, subject to the condition that they are used lawfully. All files are the property of their respective owners.
The content on the website is provided AS IS for your information and personal use only. It may not be sold, licensed, or shared on other websites without obtaining consent from the author.
E N D
Presentation Transcript
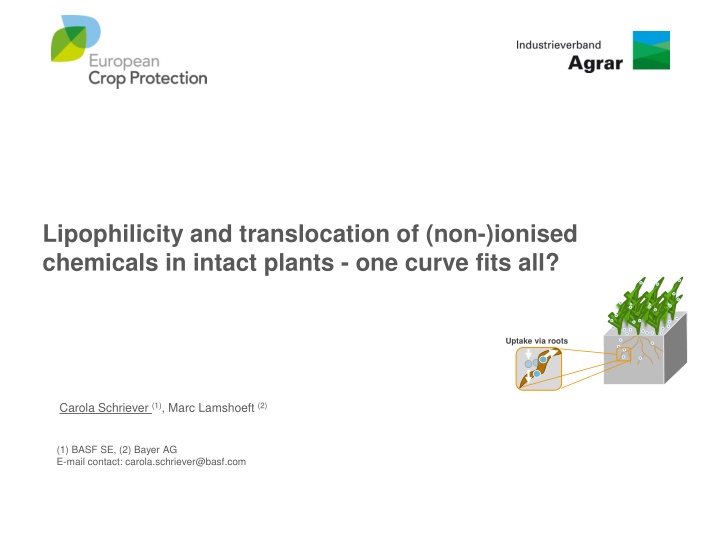
Lipophilicity and translocation of (non-)ionised chemicals in intact plants - one curve fits all? Uptake via roots Carola Schriever (1), Marc Lamshoeft(2) (1) BASF SE, (2) Bayer AG E-mail contact: carola.schriever@basf.com
Overview Why this question? Our approach The results Our conclusion An outlook
Introduction A lot of peer-reviewed studies link observed root uptake and translocation to lipophilicity of compounds OECD guideline development ongoing: see Poster XYZ Root uptake and translocation are described by the Transpiration Stream Concentration Factor (TSCF)
Introduction Lipophilicity is expressed by log P (log Kow of non-ionised molecule species) Log P - partition coefficient non-ionised species of a compound Log D - distribution coefficient - equal to log P for non-ionisable compounds - pH-dependent for ionisable compounds Different curves proposed to describe the relationship Briggs, G.G., Bromilow, R.H., Evans, A.A., 1982. Relationships between lipophilicity and root uptake and translocation of non-ionized chemicals by barley. Pestic. Sci. 13 (5), 495 504. Dettenmaier, E.M., Doucette, W.J., Bugbee, B., 2009. Chemical hydrophobicity and uptake by plant roots. Environ. Sci. Technol. 43, 324 329. Quite some variability linking log P and experimental TSCF (pH) (Doucette et al., 2018) Doucette,W.J., Shunthirasingham, C., Dettenmaier, E.M., Zaleski, R.T., Fantke, P., Arnot, J.A., 2018. A review of measured bioaccumulation data on terrestrial plants for organic chemicals: metrics, variability, and the need for standardized measurement protocol. Environ. Toxicol. Chem. 37 (1), 21 33.
Research questions Can log D help to reduce the observed variability? Which relationship exists between log D and TSCF? Can a simple mathematical model describe the relationship?
Data set Experimental TSCF values papers reviewed by Doucette et al. (2018) and study by Lamshoeft et al. (2018) Test set Non-ionisable and ionisable compounds, no perfluorinated alkyl acids (PFAA) Intact plants Exposure duration at least 1 d Medium/high data confidence Data set for further evaluation (n = 97) 80:20 split into training set (n = 80) and test set (n = 17) Starting with lowest log D value, every 5th value (incl. duplicates) is assigned to the same group Log D range of overall data set to be covered in training set Test set: group containing about 20% of the overall TSCF data set
Identification of best-fit model Visual assessment, fit statistics NSE: Nash-Sutcliff model efficiency, dimensionless goodness-of-fit indicator, rel. magnitude of residual variance compared to measured data variance, max. is 1 Linear NSE = 0.05 Sigmoidal NSE = 0.19 Gaussian NSE = 0.47 / 57* *: Two outliers removed prior to optimisation Linear model overestimates TSCF observed for low and high log D Sigmoidal model overestimates TSCF for high log D All three models are better than arithmetic mean of TSCF (NSE > 0) Gaussian model provides best description of TSCF training data set
Model performance and conclusion Test set: NSE = 0.58 similar to training set without outlier 95% confidence interval of Gaussian model* Test set About 70% of training and test set are between lower and upper bound Curve by Briggs et al. (1982) (non- ionisable compounds) overlaps or is below lower bound *: Two outliers removed prior to optimisation A log D based Gaussian model can be used to predict TSCF values for non-ionisable and ionisable compounds tested with intact plants. Schriever, C., Lamshoeft, M., 2020. Lipophilicity matters A new look at experimental plant uptake data from literature. Science of the Total Environment 713 (2020) 136667. https://doi.org/10.1016/j.scitotenv.2020.136667
Outlook What to do with the model? E.g. predict TSCF values for refined environmental exposure modelling in the absence of experimental data Measured log D (log Kow (pH) or Pow (pH) according to OECD 107/117) Predicted log D (various software tools available)
