LG System Reference for User Experience Enhancement
This website serves as a reference for LG system operating methods, focusing on UI/UX enhancement, system design, account management, and error handling. It offers user and admin authorities for different functionalities like data analysis, system monitoring, and account approval. Users can sign up to access user authority, while admins (developers) need to request admin authority. The site emphasizes security, user-friendly interfaces, and efficient system management.
Download Presentation

Please find below an Image/Link to download the presentation.
The content on the website is provided AS IS for your information and personal use only. It may not be sold, licensed, or shared on other websites without obtaining consent from the author.If you encounter any issues during the download, it is possible that the publisher has removed the file from their server.
You are allowed to download the files provided on this website for personal or commercial use, subject to the condition that they are used lawfully. All files are the property of their respective owners.
The content on the website is provided AS IS for your information and personal use only. It may not be sold, licensed, or shared on other websites without obtaining consent from the author.
E N D
Presentation Transcript
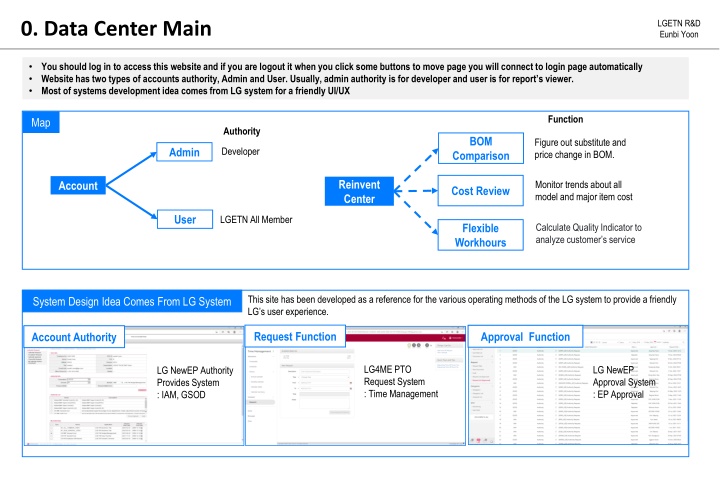
LGETN R&D Eunbi Yoon 0. Data Center Main You should log in to access this website and if you are logout it when you click some buttons to move page you will connect to login page automatically Website has two types of accounts authority, Admin and User. Usually, admin authority is for developer and user is for report s viewer. Most of systems development idea comes from LG system for a friendly UI/UX Function Map Authority BOM Figure out substitute and price change in BOM. Admin Developer Comparison Reinvent Center Monitor trends about all model and major item cost Account Cost Review User LGETN All Member Flexible Workhours Calculate Quality Indicator to analyze customer s service This site has been developed as a reference for the various operating methods of the LG system to provide a friendly LG s user experience. System Design Idea Comes From LG System Request Function Approval Function Account Authority LG4ME PTO Request System : Time Management LG NewEP Approval System : EP Approval LG NewEP Authority Provides System : IAM, GSOD
LGETN R&D Eunbi Yoon 1. Sign Up & Login Page You should log in to access this website and if you are logout it when you click some buttons to move page you will connect to login page automatically When you sign up here, you will get user authority, if you need Admin Authority then send your all sign up information referring sign-up form (eunbi1.yoon@lge.com) For sign up, all blanks are required and check detailed requirements below blanks and password different with username. e.g. username : user, password : user1357(X). Email address should be @lge.com for security purpose. Main Page Log-In Username If you are already login, it will link you to this page Log-Out
LGETN R&D Eunbi Yoon 1. Sign Up Page - Error Logic Parallelized & Serialized Structure : If user avoid duplicate username and email, user can make several different accounts N : No Error Exist Error 3 Error 2 Error 1 N N Error 2. Passwords are not same Match both password Error 1. Did not fill out all blanks Fill out all blanks Error 3. Username already taken Try different username Error 4 Error 4. Email already taken Try Forget Username /Password in Login Section N Create User Authority Accounts True
LGETN R&D Eunbi Yoon 1. Sign Up, Log In Page - Forget Username/Password If you forget password or username, please click Forget Username/Password . You will receive email showing username and password reset link. When you enter email address to reset your password, it should be LG Email(@lge.com) and match with email address that you sign up. 1 2 Click to send password reset link and username information to your email It should be matched with email that you fill when sign up. After this, click reset my password 3 4 Subject Line: Password reset on 10.225.2.85 Password can be reset if you click this link You can check your username This link is valid for 10 minutes Check email sending confirmation message
LGETN R&D Eunbi Yoon 1. Sign Up, Log In Page - Forget Username/Password Same as sign up, password should be different with username. e.g. username : user, password : user1357(X). If this method is not working to login, you can try Forget Username/Password function one again and contact to eunbi1.yoon@lge.com 5 6 Click the link to go to login page Enter New Password 7 8 Successfully login to your account Login with new password
LGETN R&D Eunbi Yoon 2. BOM Comparison - Report Access Methods You can use dashboard & report below 3 methods(1. Quick Menu, 2. Dashboard, 3. Recent Report) and dashboard is updating every Friday based on weekly data If admin want to see report history or status, add at the end of URL as /admin and click the BOM Comparison Data Model Home Dashboard Quick Menu Method1. Use Quick Menu Method2. Review all report history Method3. Recent report directly, click this Report Report If the report is too big, reduce display scale(ctrl key + scroll) Access to http://10.225.2.85/admin Choose Posts Model Database
LGETN R&D Eunbi Yoon 2. BOM Comparison - Side Bar You can move to another page, export to excel or make comments. Each report s comment page is linked with Quick Menu Comment. When you make a comment in each report, don t have to type category and week info since it recognized report page location. Side Bar Report Back Go Back To Dashboard Go Back To Home Export Data to Excel Comment GERP vs NPT Each Parts Comparison Detailed View this report s comments Make comments of this report When you click submit, comment info goes to each report comment page and quick menu comment page(you can see total comments in Data Center) Model s Trend and Graph
LGETN R&D Eunbi Yoon 2. BOM Comparison Data Sorting In Model Bar, you can click model name Front Loader , Top Loader , Dryer and it shows representative product. Click graph factor makes not display status. And if you click again, changes to display status. With this, compare graphs or detail graph view possible. All graph shows as Default . If you click graph factor, you can delete graph on the board. Axis automatically change depends on what graph is displayed. This is good when you tried to compare some of graph or review only one trend. Graph (Accuracy) Price+ Substitute Graph Model Bar Graph Factor Substitue Change Graph Model Front Loader Model Dryer Model is setting as Default Model. Depends on you choose model in model bar, it will sort each model data and show Top Loader Model
LGETN R&D Eunbi Yoon 3. Cost Review - Report Access 2 Methods You can use dashboard & report below 3 methods(1. Quick Menu, 2. Dashboard, 3. Recent Report) and dashboard is updating every Friday based on weekly data If admin want to see report history or status, add at the end of URL as /admin and click the BOM Comparison Data Model Home Dashboard Quick Menu Quick Menu Click Method1. Use Quick Menu Method1. Review all report history Method2. Recent report directly, click this Report Report Access to http://10.225.2.85/admin Choose Posts Model Database If the report is too big, reduce display scale(ctrl key + scroll)
LGETN R&D Eunbi Yoon 3. Cost Review - Side Bar You can move to another page, export to excel or make comments. Each report s comment page is linked with Quick Menu Comment. When you make a comment in each report, don t have to type category and week info since it recognized report page location. Side Bar Report Back Go Back To Dashboard Go Back To Home Export Data to Excel Comment View this report s comments Make comments of this report Graph Trend Table Data : It does not include item tag on sheet name such as FL_BPA sheet. FL_BPA sheet means Front Loader Model BPA Entity Trend. FL_PAC sheet means Front Loader Model PAC Entity Trend. Item Table Data : It has the end Item Tag such as FL_BPA_Item . FL_BPA_Item sheet means Front Loader Model BPA Entity Item Table
LGETN R&D Eunbi Yoon 3. Cost Review - Data Sorting In Model Bar, you can click model name Front Loader BPA , Top Loader PAC and it shows all of Front Loader Model BPA Entity, Top Loader Model PAC Entity Click graph factor makes not display status. And if you click again, changes to display status. With this, compare graphs or detail graph view possible. All graph shows as Default . If you click graph factor, you can delete graph on the board. Axis automatically change depends on what graph is displayed. This is good when you tried to compare some of graph or review only one trend. Graph Model Bar F3U8CNU3W.ABWEUUS Model BPA Entity Graph Graph Factor Compare BPA Entity Between F3U8CNU3W.ABWEUUS Model & F3P2CYUAW.ABWEUUS Model Front Loader Model PAC Entity Front Loader Model BPA Entity is setting as Default Model. Depends on you choose model in model bar, it will sort each model data and show Top Loader Model BPA Entity
LGETN R&D Eunbi Yoon 4. Quality Indicator - Features This is just sample report so far. But all features are setting up already and UI/UX can change depends on data save & read method and user s testing results. The data in this dashboard is randomly generated whenever you refresh page so it could feel slow when you first access to webpage and data filtering. Error Page, Sidebar Theme Page Dark Theme Light Theme Dark Theme Light Theme Divide Main Page Depends on tools Type table searching Decide how many table rows in a page v Graph Factor Click : Not Display Graph Factor Click Again: Display Service & Sales Trend When you type in search bar, it finds searching data in all columns. Graph Factor Sorting Table Search & Page Setting v Depends on how many rows in page, the count of page is changed Click forward page to see next day
LGETN R&D Eunbi Yoon 4. Quality Indicator - Data Filtering & Calculation You can sort by symptom about Product Quality KPI (pivot table, hazard graph, AAR & PPM, FFR & FDR). For this, access to Main or Product Quality KPI Page. After check symptom to click submit, please wait seconds for calculation. It calculated whenever you hit submit button. Press Cntrl+F5 key to refresh filter. Pivot Table Hazard Graph AAR & PPM FFR & FDR
LGETN R&D Eunbi Yoon 5. Comment Page - View, Add When you make comments in each report, all comments in data center are connected and you can see in Quick Menu Comment. Reverse case as well. When you make comments in quick menu comment page, each report s side bar comment page shows your comment also if the comment s report location is same. Side Bar Total Comment Each Report Comment Click Quick Menu Add Comment in Comment Page Add Comment in Report Page After Submit, if you go to comment page, you can see your comments has been added Choose Report Category for your comment. If you just want to put general comment without related with report, then choose dummy Type your comment Directly connect with comment page. And new comment is added All fields are required to fill out. If not, it shows error message
LGETN R&D Eunbi Yoon 5. Comment Page - Detail, Edit, Delete Because of space, comment page shows summary of comment body. If you want to see detail comment, click the blue letter on the top. It describes report info(category, week), commenter and comment date. Only requester edit or delete, admin does not have authority to change comments. Comment Detail Comment View Click Quick Menu You can only see Edit and Delete button on your post even though you have an Admin authority. Delete Comment View Edit Comment View Check comment information and if you click this button, it is finally deleted.
