Lecture 7b

Lecture 7b


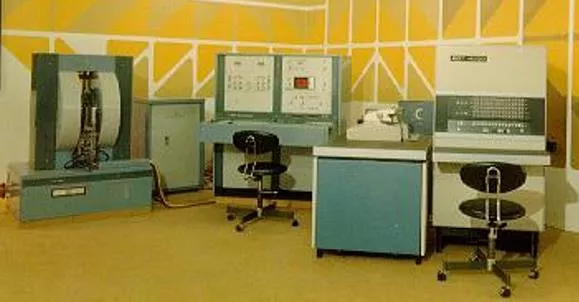
Introduction
•
Nuclear Magnetic Resonance (NMR) Spectroscopy is a
technique used to determine the type, number and relative
positions of certain atoms in a molecule.
•
Originally discovered by Felix Bloch and Edward Purcell
in 1946 (both shared the Nobel Prize in Physics in 1952 for
their pioneering work), it has seen a significant increase in
popularity with the development of FT-NMR spectrometers
(in the beginning continuous spectrometers were used)
•
NMR spectroscopy is the chemical version of MRI


Physical Background of NMR Spectroscopy I
•
Nuclei, which are moving and are charged particles, generate a magnetic field
•
The precession of a nucleus with a nonzero magnetic momentum can be described
using a vector model
•
The precession itself is a quantized phenomenon
•
The magnetic moment
m
is either aligned with (m
I
= +½) or opposed (m
I
= -½)
(for a nucleus with
I
=½) to the applied magnetic field, resulting into two
energy states
•
The nucleus with the magnetic moment
m
assumes (2*
I
+1) states for a nucleus
in an applied field i.e., deuterium (I=1): m
I
= -1, 0, 1 (three states)
Physical Background of NMR Spectroscopy II
•
A resonance phenomenon occurs when the aligned nuclei interact with the applied
field and are forced to change their spin orientation
•
The energy, which is absorbed, is equal to energy difference
E between the two
spin states. This resonance energy is about 10
-6
kJ/mol, which corresponds to energy
in the radio-frequency region.
•
The stronger the applied field, the greater
E becomes, which allows distinguishing
even between very similar atoms.
•
The NMR spectrometers with stronger magnetic fields provide better resolution revealing
more details about the structure of a molecule because they separate the signals more
•
The NMR experiment itself becomes more sensitive as well because saturation is less of
a problem
h
Physical Background of NMR Spectroscopy III
•
The exact resonance frequency of a certain nucleus depends on the
environment of the nucleus. The effective magnetic field is a result
of the applied magnetic field and the changes that are induced by the
environment.
•
The changes are often summarized into a
shielding constant
,
. The larger
the shielding constant and the smaller the effective field, the higher the
applied field has to be in order for the nucleus to resonate as constant
frequency. If a constant magnetic field is applied, the resonance frequency
will decrease with increasing shielding.
•
In
1
H-NMR spectroscopy, the diamagnetic and neighboring effects are the
most important contributions because only s-orbitals are important here.
•
In
13
C-NMR, the paramagnetic term becomes more significant because of
the involvement of p-electrons.
NMR active Nuclei
•
Although hydrogen atoms and carbon atoms are typically of most interest to
organic chemist, there are many other nuclei that are of common interest
•
In order for an atom to be NMR active, the spin quantum number (
I
) must be
non-zero.
•
If the proton and neutron number are even and equal, the spin quantum number
will be zero. Both
12
C and
16
O will not be observable, but
13
C and
17
O are active.
•
There is a significant difference in abundance in these NMR active nuclei and
the sensitivity of these experiments differs quite a bit as well.
13
C-NMR Spectroscopy - Introduction
•
The
13
C-atom possesses like protons a nuclear spin of
I=½
.
•
Unfortunately, the signals are much weaker because of the lower natural
abundance of the
13
C-isotope (~1 %). Overall, the
13
C-nucleus is about
6000 times less receptive than
1
H-nucleus (see previous table).
•
Most spectra are acquired as
proton decoupled spectra
, which means that
signal is not split by any attached protons (only singlets will be observed
in the spectrum).
•
A methylene group shows as a triplet in a
proton coupled spectrum
,
but displays a singlet in a
proton decoupled spectrum
.
•
The sensitivity of the experiment increases because the already weak
signal is not further split up, but some important information is lost
i.e., how many hydrogen atoms are attached to the carbon.
•
Note that couplings between carbon and deuterium atoms (and other
NMR active nuclei i.e., P, F) are still observed i.e., CDCl
3
, which shows
three lines (2*n*
I
+1,
I
=1, n=1) at
=77 ppm.
13
C-NMR Spectroscopy - Chemical Shift
•
The smaller magnetogyric ratio compared to hydrogen causes a lower
resonance frequency in addition (about a quarter of the one used for
hydrogen nuclei i.e.,
1
H-NMR: 400 MHz,
13
C-NMR: 100 MHz).
•
The effect of shielding and deshielding is much stronger for the carbon
nucleus because the heteroatom, which causes this chemical shift, is directly
attached to the carbon atom.
•
While proton NMR spectra are mainly limited in a range between 0-15 ppm,
the chemical shifts in
13
C-NMR spectroscopy range from 0-220 ppm.
13
C-NMR Spectroscopy - Chemical Shift
•
In addition, the chemical shift also reveals some information about the chemical environment.
•
Like in
1
H-NMR spectra, there is a characteristic range for carbons with
sp
3
hybridization (
=0-100
ppm) and
sp
2
(
=100-220 ppm). The
sp
-hybridized carbon atoms can be found in the range between
=60-130 ppm.
•
Electronegative atoms like oxygen, nitrogen, chlorine and fluorine cause a downfield shift of the
carbon signal.
•
Carbon atoms in carbonyl and imine functions are shifted downfield due to the effect of hybridization
and
electronegativity. This effect will be less pronounced if these functions are conjugated because
the polarization is less.
•
Carbocations display significantly higher chemicals i.e.,
tert.
-butyl: 335.7 ppm,
iso
-propyl: 317.8 ppm,
tropylium: 156.2 ppm (
sp
3
-C), etc. because of the higher positive charge on the carbon atom
13
C-NMR Spectroscopy - Symmetry
•
Symmetry
•
If there are fewer signals than atoms of a particular kind, there
has to be
symmetry
in the molecule because atoms with the same
chemical (or more accurately magnetic) environment show up at
the same location in the spectrum, which usually results in a
larger signal.
•
Even for simple groups this assumes that there is free rotation
around
-bonds which will strictly speaking only be true when
the temperature is high enough to provide enough energy for
this process and if there is no preferentially arrangement of
the molecule that generates an asymmetric environment
(i.e., intramolecular hydrogen bonds, resonance, etc.).
DEPT-Introduction
•
Recall that most
13
C-NMR are acquired as proton decoupled
spectra because of the
13
C nucleus is significantly less
abundant than the
1
H nucleus
•
D
istortionless
E
nhancement by
P
olarization
T
ransfer, or
also called
DEPT
, is a technique that is used to compensate
for some shortcomings of
13
C-NMR spectroscopy
•
The technique utilizes the fact that different CH functions
behave differently in an experiment, where the polarization
is transferred from the proton to the carbon atom
•
Some spin states are changed, which causes a greater imbalance
between different energy states and an enhanced sensitivity.
DEPT-Example
•
The original spectrum of
isoamyl acetate displays
only six signals due to the
symmetry in the side chain
•
The carbonyl carbon atom
at
=172 ppm does not
show up in either DEPT
spectrum because it is
quaternary
•
The methylene functions
at
=38 ppm and
=61
ppm point down in the
DEPT 135 spectrum
•
The methine function at
=25 ppm shows up in all
three DEPT spectra
•
The DEPT spectrum can
not determine which of the
signals at
=21 ppm and
=24 ppm belongs to C1
and C6 (only one signal
due to symmetry!)
Full Spectrum
DEPT 135
DEPT 45
DEPT 90
2
3
4
5
1/6
DEPT-Examples
•
The full spectrum
of camphor displays
ten signals
•
The signal at
=215
ppm is due to the
carbonyl group
•
The signals at
=47
ppm and
=57 ppm
are due to the other
two quaternary
carbon atoms
•
Thus, these three
carbon atoms do not
appear in any of the
DEPT spectra
1
2
3
DEPT-Examples
•
The range of the DEPT
spectra show here is from
=0-50 ppm (the three
quaternary peaks are
removed)
•
The signal at
=43.6 ppm
(furthest to the left) is due
to the methine function
(C4)
•
The signals at
=43.4 ppm,
=30 ppm and
=27 ppm
are due to methylene
groups (C5, C6, C7)
•
The signals at
=19.8 ppm,
=19.2 ppm and
=9 ppm
are due to the methyl
groups (C8, C9, C10)
•
For the methylene and the
methyl groups, it is very
difficult to determine which
signal is due to which
carbon atom without
additional information
4
5
6
7
8 9
10
DEPT-Examples
•
The reaction of 1,2-Diphenylpropanediol with acids leads to
the formation of an aldehyde (I) or ketone (II) (or a mixture
of them) depending on the conditions during the reaction
(i.e., temperature, amount and type of catalyst, etc.).
•
How could the
13
C-NMR spectrum and the DEPT spectra be
used to determine the nature of the product?
DEPT-Examples
•
The aldehyde
displays seven
signals due to the
symmetry of the two
phenyl groups.
•
Aldehyde carbon:
201 ppm
•
Four carbon atoms:
126-145 ppm
(small (ipso),
medium (para),
two tall (ortho,
meta))
•
Quaternary carbon
atom: 62 ppm
•
Methyl group:
21 ppm
•
Full Spectrum
DEPT 135
DEPT 90
DEPT 45
DEPT-Examples
•
The ketone displays
eleven signals due to
the lack of symmetry
•
Ketone carbon:
200 ppm
•
Eight carbon atoms:
128-141 ppm (two
small (ipso), two
medium (para), four
tall (ortho, meta))
•
Methine carbon
atom: 48 ppm
•
Methyl group:
20 ppm
Full Spectrum
DEPT 135
DEPT 90
DEPT 45
Problem Solving Strategy
•
Strategy for solving structure problems with
13
C-NMR spectra
•
Step 1: Determine degrees of unsaturation from molecular formula.
•
Degree of unsaturation
=
•
Step 2: Determine if there is symmetry in the molecule
•
Step 3: Determine the hybridization of carbon atoms giving rise
to observed signals
•
Step 4: Determine the number of hydrogen atoms on each
carbon atom
•
Step 5: Put the pieces together. Make sure that all atoms have
proper valences (i.e., carbon: 4, hydrogen: 1, oxygen: 2)
•
Step 6: Make sure that the structure is consistent with the formula
(and other information provided)
In-lab Assignment
•
Make sure to bring the handout/worksheet with you that was sent to you
last week
•
During the
13
C-NMR lab, your TA will assign one molecular formula/group
(=2 students).
•
Each group will try
to draw five isomers and predict the
13
C-NMR spectra
for that molecule in the work sheets.
•
Each group will go to SLC lab (the TA will tell you which room to use) and
use computer to generate the spectra for each of your isomers (use the
ACD/NMR program, which can be found in Start--Programs ACD Labs.
•
Inside ACD Labs is C-NMR and H-NMR
•
Each group MUST answer all the questions in the FIRST page on the
“work sheets” before turning in the sheets immediately after the meeting
•
Make sure to write the names of the group members on the work sheets. If
the your name is not on the worksheet, you will not receive credit.
Nuclear Magnetic Resonance (NMR) Spectroscopy is a powerful technique used to analyze atomic structures in molecules. This technique, developed by Felix Bloch and Edward Purcell, has revolutionized the field of chemistry. Understanding the physical background of NMR spectroscopy is crucial for interpreting NMR spectra accurately. This overview covers the principles behind NMR spectroscopy, including the behavior of nuclei in magnetic fields, resonance phenomena, and the impact of environmental factors on resonance frequencies. Dive into the world of NMR spectroscopy and unravel the secrets of molecular structures.

Download Presentation

Please find below an Image/Link to download the presentation.
The content on the website is provided AS IS for your information and personal use only. It may not be sold, licensed, or shared on other websites without obtaining consent from the author.If you encounter any issues during the download, it is possible that the publisher has removed the file from their server.
You are allowed to download the files provided on this website for personal or commercial use, subject to the condition that they are used lawfully. All files are the property of their respective owners.
The content on the website is provided AS IS for your information and personal use only. It may not be sold, licensed, or shared on other websites without obtaining consent from the author.
E N D
Presentation Transcript
Lecture 7b 13C-NMR Spectroscopy
Introduction Nuclear Magnetic Resonance (NMR) Spectroscopy is a technique used to determine the type, number and relative positions of certain atoms in a molecule. Originally discovered by Felix Bloch and Edward Purcell in 1946 (both shared the Nobel Prize in Physics in 1952 for their pioneering work), it has seen a significant increase in popularity with the development of FT-NMR spectrometers (in the beginning continuous spectrometers were used) NMR spectroscopy is the chemical version of MRI http://www.chem.ucla.edu/harding/IGOC/N/nmr_spectrometer01.gif http://upload.wikimedia.org/wikipedia/commons/thumb/e/ee/MRI-Philips.JPG/220px-MRI-Philips.JPG
Physical Background of NMR Spectroscopy I Nuclei, which are moving and are charged particles, generate a magnetic field The precession of a nucleus with a nonzero magnetic momentum can be described using a vector model The precession itself is a quantized phenomenon The magnetic moment m is either aligned with (mI= + ) or opposed (mI= - ) (for a nucleus with I= ) to the applied magnetic field, resulting into two energy states The nucleus with the magnetic moment m assumes (2*I+1) states for a nucleus in an applied field i.e., deuterium (I=1): mI= -1, 0, 1 (three states) Energy mI= - E= f( Bo)= h mI= + Increased magnetic field Bo
Physical Background of NMR Spectroscopy II A resonance phenomenon occurs when the aligned nuclei interact with the applied field and are forced to change their spin orientation The energy, which is absorbed, is equal to energy difference E between the two spin states. This resonance energy is about 10-6 kJ/mol, which corresponds to energy in the radio-frequency region. h The stronger the applied field, the greater E becomes, which allows distinguishing even between very similar atoms. The NMR spectrometers with stronger magnetic fields provide better resolution revealing more details about the structure of a molecule because they separate the signals more The NMR experiment itself becomes more sensitive as well because saturation is less of a problem
Physical Background of NMR Spectroscopy III The exact resonance frequency of a certain nucleus depends on the environment of the nucleus. The effective magnetic field is a result of the applied magnetic field and the changes that are induced by the environment. Heff= Ho Ho The changes are often summarized into a shielding constant, . The larger the shielding constant and the smaller the effective field, the higher the applied field has to be in order for the nucleus to resonate as constant frequency. If a constant magnetic field is applied, the resonance frequency will decrease with increasing shielding. = 2 Bo(1 ) = dia+ para+ neighbor+ medium In 1H-NMR spectroscopy, the diamagnetic and neighboring effects are the most important contributions because only s-orbitals are important here. In 13C-NMR, the paramagnetic term becomes more significant because of the involvement of p-electrons.
NMR active Nuclei Although hydrogen atoms and carbon atoms are typically of most interest to organic chemist, there are many other nuclei that are of common interest In order for an atom to be NMR active, the spin quantum number (I) must be non-zero. If the proton and neutron number are even and equal, the spin quantum number will be zero. Both 12C and 16O will not be observable, but 13C and 17O are active. There is a significant difference in abundance in these NMR active nuclei and the sensitivity of these experiments differs quite a bit as well. Nucleus Spin Quantum Number, I 1 0 1 0 5 2 Natural Abundance 99.985 % 0.015 % trace 98.89 % 1.11 % 99.6 % 0.37 % 99.76 % 0.04 % 100 % 100 % Magnetogyric ratio, g (107 rad T-1s-1) 26.7519 4.1066 28.535 NMR Active Receptivity compared to 1H-nucleus 1.00 1.50*10-6 4.00*10-18 1H 2H 3H 12C 13C 14N 15N 16O 17O 19F 31P YES YES YES NO YES YES YES NO YES YES YES 6.7283 1.934 -2.712 1.70*10-4 1.01*10-3 3.85*10-6 -3.62808 25.181 10.841 1.11*10-5 8.30*10-1 6.63*10-3
13C-NMR Spectroscopy - Introduction The 13C-atom possesses like protons a nuclear spin of I= . Unfortunately, the signals are much weaker because of the lower natural abundance of the 13C-isotope (~1 %). Overall, the 13C-nucleus is about 6000 times less receptive than 1H-nucleus (see previous table). Most spectra are acquired as proton decoupled spectra, which means that signal is not split by any attached protons (only singlets will be observed in the spectrum). A methylene group shows as a triplet in a proton coupled spectrum, but displays a singlet in a proton decoupled spectrum. The sensitivity of the experiment increases because the already weak signal is not further split up, but some important information is lost i.e., how many hydrogen atoms are attached to the carbon. Note that couplings between carbon and deuterium atoms (and other NMR active nuclei i.e., P, F) are still observed i.e., CDCl3, which shows three lines (2*n*I+1, I=1, n=1) at =77 ppm. CH2 group 13C{1H} CH2 group 13C
13C-NMR Spectroscopy - Chemical Shift The smaller magnetogyric ratio compared to hydrogen causes a lower resonance frequency in addition (about a quarter of the one used for hydrogen nuclei i.e., 1H-NMR: 400 MHz, 13C-NMR: 100 MHz). The effect of shielding and deshielding is much stronger for the carbon nucleus because the heteroatom, which causes this chemical shift, is directly attached to the carbon atom. While proton NMR spectra are mainly limited in a range between 0-15 ppm, the chemical shifts in 13C-NMR spectroscopy range from 0-220 ppm. Functional Type Carbonyl compounds (C=O) Aldehyde and ketone Carboxylic acid, ester, anhydrides Amide Imine (C=N) Aromatic and alkene Nitrile Alkyne O-C, Ether C-X, Alkyl halide RCH2R, Alkyl Hybridization Chemical Shift (ppm) 185-220 160-185 150-180 140-170 100-170 120-130 60-100 60-90 10-65 0-50 sp2 sp2 sp2 sp sp sp3 sp3 sp3
13C-NMR Spectroscopy - Chemical Shift In addition, the chemical shift also reveals some information about the chemical environment. Like in 1H-NMR spectra, there is a characteristic range for carbons with sp3 hybridization ( =0-100 ppm) and sp2 ( =100-220 ppm). The sp-hybridized carbon atoms can be found in the range between =60-130 ppm. Electronegative atoms like oxygen, nitrogen, chlorine and fluorine cause a downfield shift of the carbon signal. Carbon atoms in carbonyl and imine functions are shifted downfield due to the effect of hybridization and electronegativity. This effect will be less pronounced if these functions are conjugated because the polarization is less. Carbocations display significantly higher chemicals i.e., tert.-butyl: 335.7 ppm, iso-propyl: 317.8 ppm, tropylium: 156.2 ppm (sp3-C), etc. because of the higher positive charge on the carbon atom Csp
13C-NMR Spectroscopy - Symmetry Symmetry If there are fewer signals than atoms of a particular kind, there has to be symmetry in the molecule because atoms with the same chemical (or more accurately magnetic) environment show up at the same location in the spectrum, which usually results in a larger signal. Even for simple groups this assumes that there is free rotation around -bonds which will strictly speaking only be true when the temperature is high enough to provide enough energy for this process and if there is no preferentially arrangement of the molecule that generates an asymmetric environment (i.e., intramolecular hydrogen bonds, resonance, etc.).
DEPT-Introduction Recall that most 13C-NMR are acquired as proton decoupled spectra because of the 13C nucleus is significantly less abundant than the 1H nucleus Distortionless Enhancement by Polarization Transfer, or also called DEPT, is a technique that is used to compensate for some shortcomings of 13C-NMR spectroscopy The technique utilizes the fact that different CH functions behave differently in an experiment, where the polarization is transferred from the proton to the carbon atom Some spin states are changed, which causes a greater imbalance between different energy states and an enhanced sensitivity. # of attached hydrogens DEPT 135 DEPT 90 DEPT 45 0 (-C-) 0 0 0 1 (CH) up up up 2 (CH2) down 0 up 3 (CH3) up 0 up
DEPT-Example 120 The original spectrum of isoamyl acetate displays only six signals due to the symmetry in the side chain The carbonyl carbon atom at =172 ppm does not show up in either DEPT spectrum because it is quaternary The methylene functions at =38 ppm and =61 ppm point down in the DEPT 135 spectrum The methine function at =25 ppm shows up in all three DEPT spectra The DEPT spectrum can not determine which of the signals at =21 ppm and =24 ppm belongs to C1 and C6 (only one signal due to symmetry!) 1/6 Full Spectrum 115 110 105 23.51 100 95 90 85 80 75 3 4 5 70 65 60 55 61.63 37.50 25.31 20.98 50 45 40 35 2 30 25 20 172.03 15 10 5 0 170 160 150 140 130 120 110 100 90 80 70 60 50 40 30 20 10 130 120 DEPT 135 110 23.51 100 90 80 70 60 25.31 20.98 50 40 30 20 10 0 -10 -20 -30 -40 -50 61.63 37.50 -60 -70 -80 120 170 160 150 140 130 120 110 100 90 80 70 60 50 40 30 20 115 DEPT 90 110 105 25.31 100 95 90 85 80 75 70 65 60 55 50 45 40 35 30 25 20 15 10 5 0 170 160 150 140 130 120 110 100 90 80 70 60 50 40 30 20 10 120 115 DEPT 45 110 105 23.51 100 95 90 85 80 75 70 65 60 55 61.63 37.50 25.31 20.98 50 45 40 35 30 25 20 15 10 5 0 170 160 150 140 130 120 110 100 90 80 70 60 50 40 30 20 10
DEPT-Examples 120 The full spectrum of camphor displays ten signals The signal at =215 ppm is due to the carbonyl group The signals at =47 ppm and =57 ppm are due to the other two quaternary carbon atoms Thus, these three carbon atoms do not appear in any of the DEPT spectra 115 110 105 43.55 30.06 27.19 19.21 100 95 90 85 80 75 70 65 60 55 50 45 40 2 35 3 30 218.40 57.49 25 1 20 15 10 5 0 200 150 100 50
DEPT-Examples The range of the DEPT spectra show here is from =0-50 ppm (the three quaternary peaks are removed) The signal at =43.6 ppm (furthest to the left) is due to the methine function (C4) The signals at =43.4 ppm, =30 ppm and =27 ppm are due to methylene groups (C5, C6, C7) The signals at =19.8 ppm, =19.2 ppm and =9 ppm are due to the methyl groups (C8, C9, C10) For the methylene and the methyl groups, it is very difficult to determine which signal is due to which carbon atom without additional information 4 19.21 19.80 43.55 9.36 100 6 7 50 0 8 9 10 5 -50 -100 43.39 30.06 27.19 45 40 35 30 25 20 15 10 5 120 115 110 105 43.55 100 95 90 85 80 75 70 65 60 55 50 45 40 35 30 25 20 15 10 5 0 45 40 35 30 25 20 15 10 5 120 115 110 43.39 43.55 19.21 19.80 105 30.06 27.19 9.36 100 95 90 85 80 75 70 65 60 55 50 45 40 35 30 25 20 15 10 5 0 45 40 35 30 25 20 15 10 5
DEPT-Examples The reaction of 1,2-Diphenylpropanediol with acids leads to the formation of an aldehyde (I) or ketone (II) (or a mixture of them) depending on the conditions during the reaction (i.e., temperature, amount and type of catalyst, etc.). How could the 13C-NMR spectrum and the DEPT spectra be used to determine the nature of the product?
DEPT-Examples 120 The aldehyde displays seven signals due to the symmetry of the two phenyl groups. Aldehyde carbon: 201 ppm Four carbon atoms: 126-145 ppm (small (ipso), medium (para), two tall (ortho, meta)) Quaternary carbon atom: 62 ppm Methyl group: 21 ppm Full Spectrum 115 110 128.30 105 100 95 90 85 80 75 70 65 60 55 126.22 50 45 40 35 30 201.45 20.53 25 20 145.11 15 62.29 10 5 0 200 150 100 50 0 120 115 DEPT 135 110 128.30 105 100 95 90 85 80 75 70 65 60 55 126.22 50 45 40 35 30 201.45 20.53 25 20 15 10 5 0 200 150 100 50 0 120 115 DEPT 90 110 128.30 105 100 95 90 85 80 75 70 65 60 55 126.22 50 45 40 35 30 201.45 25 20 15 10 5 0 200 150 100 50 120 115 DEPT 45 110 128.30 105 100 95 90 85 80 75 70 65 60 55 126.22 50 45 40 35 30 201.45 20.53 25 20 15 10 5 0 200 150 100 50
DEPT-Examples 120 Full Spectrum The ketone displays eleven signals due to the lack of symmetry Ketone carbon: 200 ppm Eight carbon atoms: 128-141 ppm (two small (ipso), two medium (para), four tall (ortho, meta)) Methine carbon atom: 48 ppm Methyl group: 20 ppm 115 110 128.03 128.30 129.33 105 100 95 90 85 80 75 70 65 60 126.80 132.80 55 47.80 19.50 50 45 40 35 30 25 20 136.40 141.40 200.20 15 10 5 0 200 150 100 50 120 115 DEPT 135 110 128.03 128.30 129.33 105 100 95 90 85 80 75 70 65 60 126.80 132.80 55 47.80 19.50 50 45 40 35 30 25 20 15 10 5 0 200 150 100 50 120 115 DEPT 90 110 128.03 128.30 129.33 105 100 95 90 85 80 75 70 65 60 126.80 132.80 55 47.80 50 45 40 35 30 25 20 15 10 5 0 200 150 100 50 120 115 DEPT 45 110 128.03 128.30 129.33 105 100 95 90 85 80 75 70 65 60 126.80 132.80 55 47.80 19.50 50 45 40 35 30 25 20 15 10 5 0 200 150 100 50
Problem Solving Strategy Strategy for solving structure problems with 13C-NMR spectra Step 1: Determine degrees of unsaturation from molecular formula. (number of bonds each atom can form-2) + 2 2 Degree of unsaturation = all atoms Step 2: Determine if there is symmetry in the molecule Step 3: Determine the hybridization of carbon atoms giving rise to observed signals Step 4: Determine the number of hydrogen atoms on each carbon atom Step 5: Put the pieces together. Make sure that all atoms have proper valences (i.e., carbon: 4, hydrogen: 1, oxygen: 2) Step 6: Make sure that the structure is consistent with the formula (and other information provided)
In-lab Assignment Make sure to bring the handout/worksheet with you that was sent to you last week During the 13C-NMR lab, your TA will assign one molecular formula/group (=2 students). Each group will tryto draw five isomers and predict the 13C-NMR spectra for that molecule in the work sheets. Each group will go to SLC lab (the TA will tell you which room to use) and use computer to generate the spectra for each of your isomers (use the ACD/NMR program, which can be found in Start--Programs ACD Labs. Inside ACD Labs is C-NMR and H-NMR Each group MUST answer all the questions in the FIRST page on the work sheets before turning in the sheets immediately after the meeting Make sure to write the names of the group members on the work sheets. If the your name is not on the worksheet, you will not receive credit.