Labor Market Report: Verdugo Region


The
Verdugo
Workforce
Development
Board
(VWDB)
envisions
an
economically
vibrant,
tri-city
region
with
thriving
businesses,
youth,
and
job-seekers
on
career
paths
that
reflect
their
highest
potential.
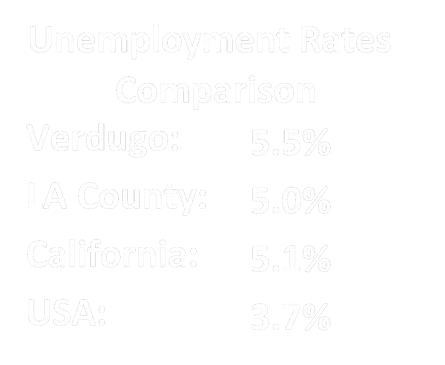
ANNUAL UNEMPLOYMENT RATES BY CITY
Source:
Employment
Development
Department
Labor
Market
Information
Division
Reporting
Period:
December 2023
1
Labor
Market Report:
Verdugo
Region
December 2023
Quarterly Issue


8,600


57,500


99,400

1
65,5
00


VERDUGO REGION LABOR FORCE (RESIDENTS)
Labor force numbers are based on EDD estimates of the number of residents who earned at least $1 during the
reporting period. These residents may be working outside of the Verdugo Consortium. The total Verdugo labor
force as of
December 2023
is 1
65,500
.
Verdugo
Workforce
Development
Board
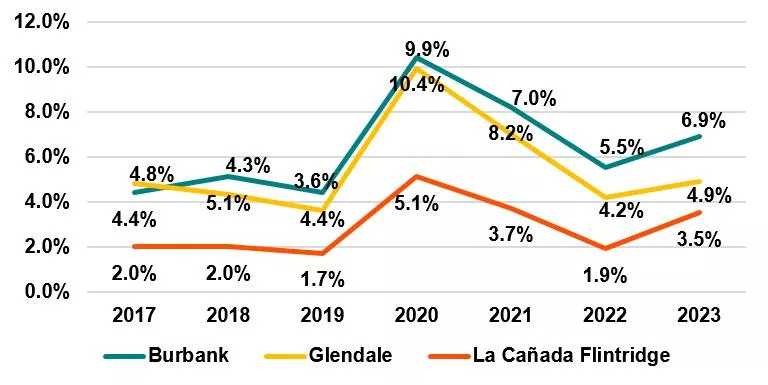
UNEMPLOYMENT RATES COMPARISON
The unemployment rate
de
creased in the Verdugo Region and LA County.


2
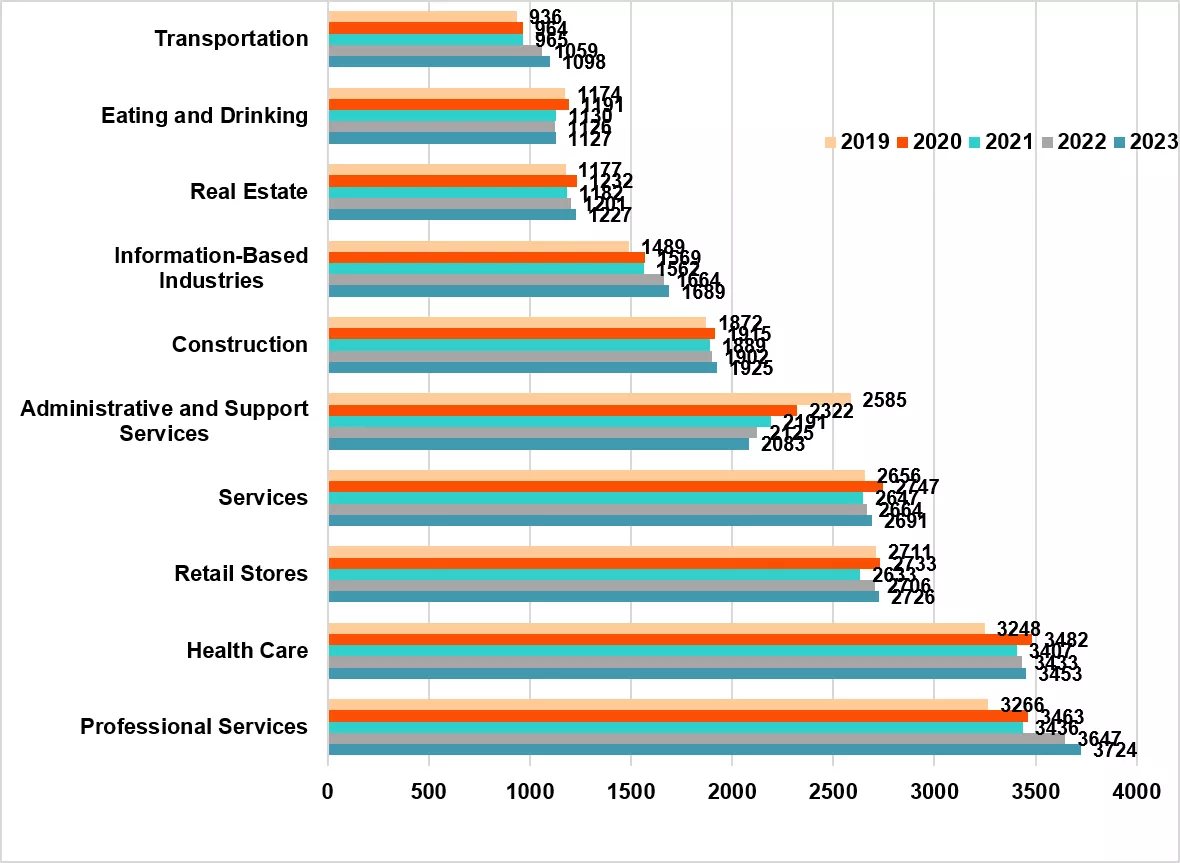
Number of businesses in the Verdugo Consortium is determined by their industry sector when selecting the North
American Industry Classification System (NAICS) code when they register with Dun & Bradstreet.
The Information sector includes publishing, broadcasting and social media; however, Information Technology falls
under Professional Services. Services includes repair and maintenance as well as personal services such as
housekeeping and laundry. Administrative and Support Services include office, employment, travel, and security
services.
By the end of 2023, almost all of the top ten industry sectors have more businesses in the Verdugo Region
compared to 2022. The number of Administrative and Support Services businesses continue to decrease by 20%
since 2019. Businesses in Information Based lndustries increased by
13% since 2019.
Transportation and
Professional Services business also continue to increase by 17% and 14% respectively since 2019.
These trends
will likely continue given
both
the
market
demands as well as the impact of the current economic landscape
.
TOP 10 INDUSTRY SECTORS FOR
BUSINESS
- VERDUGO CONSORTIUM
Source:
Dun & Bradstreet and Econovue
Labor
Market
Report
:
Verdugo
Region
Verdugo
Workforce
Development
Board
December 2023
Quarterly Issue
3
TOP OCCUPATIONS IN JOB ADS – VERDUGO AREA
Source:
Employment
Development
Department
Labor
Market
Information
Division
Reporting
Period:
December 2023
TOP 5 EMPLOYERS POSTING JOBS – VERDUGO AREA
CITIES WITH THE MOST JOB ADS
Labor
Market Report:
Verdugo
Region
Verdugo
Workforce
Development
Board
*Increase/Decrease from
September 2023
Verdugo LMI report.
The total number of job ads for the Top 10 Occupations
in
creased by
38
% from
2,453 in September 2023 to 3,409 in
December 2023
. This trend
may be d
ue to
the labor shortages in certain industries.
December 2023
Quarterly Issue
4
DEFINITIONS
Labor force
: Persons classified as employed or unemployed.
Employed persons:
Persons 16 years and over in the civilian noninstitutional population who, during the
reference week, (a) did any work at all (at least 1 hour) as paid employees; worked in their own business,
profession, or on their own farm, or worked 15 hours or more as unpaid workers in an enterprise operated by a
member of the family; and (b) all those who were not working but who had jobs or businesses from which they
were temporarily absent because of vacation, illness, bad weather, childcare problems, maternity or paternity
leave, labor-management dispute, job training, or other family or personal reasons, whether or not they were
paid for the time off or were seeking other jobs. Each employed person is counted only once, even if he or she
holds more than one job. Excluded are persons whose only activity consisted of work around their own house
(painting, repairing, or own home housework) or volunteer work for religious, charitable, and other
organizations.
Unemployed persons:
Persons aged 16 years and older who had no employment during the reference week,
were available for work, except for temporary illness, and had made specific efforts to find employment
sometime during the 4-week period ending with the reference week. Persons who were waiting to be recalled to
a job from which they had been laid off need not have been looking for work to be classified as unemployed.
Unemployment rate:
The unemployment rate represents the number unemployed as a percent of the labor
force.
Source:
US Bureau of Labor Statistics
Labor
Market Report:
Verdugo
Region
Verdugo
Workforce
Development
Board
December 2023
Quarterly Issue
The Verdugo Workforce Development Board's latest labor market report reveals data on annual unemployment rates, industry sectors, and job ads in the tri-city region. Key highlights include a decrease in unemployment rates, growth in various industry sectors, and insights on job market trends for residents. The report aims to support economic vibrancy and career development in the Verdugo Region.

Download Presentation

Please find below an Image/Link to download the presentation.
The content on the website is provided AS IS for your information and personal use only. It may not be sold, licensed, or shared on other websites without obtaining consent from the author.If you encounter any issues during the download, it is possible that the publisher has removed the file from their server.
You are allowed to download the files provided on this website for personal or commercial use, subject to the condition that they are used lawfully. All files are the property of their respective owners.
The content on the website is provided AS IS for your information and personal use only. It may not be sold, licensed, or shared on other websites without obtaining consent from the author.
E N D
Presentation Transcript
VerdugoWorkforceDevelopmentBoard December 2023 Quarterly Issue LaborMarket Report:VerdugoRegion The Verdugo Workforce Development Board (VWDB) envisions an economically vibrant, tri-city region with thriving businesses, youth, and job-seekers on career paths that reflect their highest potential. ANNUAL UNEMPLOYMENT RATES BY CITY 12.0% UnemploymentRates Comparison Verdugo: LA County: California: USA: 9.9% 10.0% 10.4% 7.0% 8.0% 6.9% 5.5% 5.0% 5.1% 3.7% 8.2% 5.5% 6.0% 4.3% 4.8% 3.6% 4.9% 4.0% 5.1% 5.1% 4.2% 4.4% 4.4% 3.7% 3.5% 2.0% 2.0% 2.0% 1.9% 1.7% 0.0% 2017 2018 2019 2020 2021 2022 2023 Burbank Glendale La Ca ada Flintridge UNEMPLOYMENT RATES COMPARISON The unemployment rate decreased in the Verdugo Region and LA County. December 2020 November 2021 December 2022 September 2023 December 2023 10.7% 10.4% 9.9% 9.8% 8.8% 8.5% 8.2% 7.2% 7.1% 7.0% 6.9% 6.7% 6.7% 5.8% 5.8% 5.5% 5.5% 5.4% 5.1% 5.1% 5.0% 4.9% 4.9% 4.5% 4.4% 4.2% 4.2% 4.0% 3.7% 3.7% 3.7% 3.6% 3.5% 3.3% 1.9% BURBANK GLENDALE LA CA ADA FLINTRIDGE VERDUGO LOS CALIFORNIA USA ANGELES COUNTY VERDUGO REGION LABOR FORCE (RESIDENTS) 8,600 99,400 165,500 57,500 Labor force numbers are based on EDD estimates of the number of residents who earned at least $1 during the reporting period. These residents may be working outside of the Verdugo Consortium. The total Verdugo labor force as of December 2023 is 165,500. Source:EmploymentDevelopmentDepartmentLaborMarketInformationDivision ReportingPeriod:December 2023 1
VerdugoWorkforceDevelopmentBoard December 2023 Quarterly Issue LaborMarket Report:VerdugoRegion TOP 10 INDUSTRY SECTORS FOR BUSINESS- VERDUGO CONSORTIUM 936 964 Transportation 965 1059 1098 1174 1191 Eating and Drinking 1130 1126 1127 1177 2019 2020 2021 2022 2023 1232 Real Estate 1182 1201 1227 1489 Information-Based Industries 1569 1562 1664 1689 1872 1915 Construction 1889 1902 1925 2585 Administrative and Support Services 2322 2191 2125 2083 2656 2747 Services 2647 2664 2691 2711 2733 Retail Stores 2633 2706 2726 3248 3482 Health Care 3407 3433 3453 3266 3463 Professional Services 3436 3647 3724 0 500 1000 1500 2000 2500 3000 3500 4000 Number of businesses in the Verdugo Consortium is determined by their industry sector when selecting the North American Industry Classification System (NAICS) code when they register with Dun & Bradstreet. The Information sector includes publishing, broadcasting and social media; however, Information Technology falls under Professional Services. Services includes repair and maintenance as well as personal services such as housekeeping and laundry. Administrative and Support Services include office, employment, travel, and security services. By the end of 2023, almost all of the top ten industry sectors have more businesses in the Verdugo Region compared to 2022. The number of Administrative and Support Services businesses continue to decrease by 20% since 2019. Businesses in Information Based lndustries increased by 13% since 2019. Transportation and Professional Services business also continue to increase by 17% and 14% respectively since 2019. These trends will likely continue given both the market demands as well as the impact of the current economic landscape. Source:Dun & Bradstreet and Econovue 2
VerdugoWorkforceDevelopmentBoard December 2023 Quarterly Issue LaborMarket Report:VerdugoRegion CITIES WITH THE MOST JOB ADS Culver City 2013 Help Wanted Online from The Conference Board and WANTED Technologies report the top ten cities in the Los Angeles County with the most job ads. Consistently, Burbank and Glendale are reported amongst these top ten cities with the number of job ads posted for the reporting month. This indicates the economic vibrancy of the businesses in the Verdugo community relative to the other cities located in the region. El Segundo 2581 Santa Clarita 2664 Glendale 3055 Burbank 3148 Pasadena 3498 Santa Monica 3783 Torrance 4066 Long Beach 5085 Los Angeles 58309 0 10000 20000 30000 40000 50000 60000 70000 TOP OCCUPATIONS IN JOB ADS VERDUGO AREA OCCUPATION # OF JOB ADS 1. Registered Nurses 1,302 2. Retail Salespersons 449 3. First-Line Supervisors of Retail Sales Workers 269 4. Fast Food and Counter Workers 243 5. Sales Representatives, Wholesale and Manufacturing 237 6. Customer Service Representatives 202 7. Home Health and Personal Care Aides 184 8. Medical and Health Services Managers 181 9. Security Guards 176 10. Managers, All Other 166 The total number of job ads for the Top 10 Occupations increased by 38% from 2,453 in September 2023 to 3,409 in December2023. This trend may be due to the labor shortagesin certain industries. TOP 5 EMPLOYERS POSTING JOBS VERDUGO AREA 114 Ads NEW 133 Ads (2%) 557 Ads (37%) 269 Ads (305%) 268 Ads (0.3%) *Increase/Decrease from September 2023 Verdugo LMI report. Source:EmploymentDevelopmentDepartmentLaborMarketInformationDivision ReportingPeriod:December 2023 3
VerdugoWorkforceDevelopmentBoard December 2023 Quarterly Issue LaborMarket Report:VerdugoRegion DEFINITIONS Labor force: Persons classified as employed or unemployed. Employed persons: Persons 16 years and over in the civilian noninstitutional population who, during the reference week, (a) did any work at all (at least 1 hour) as paid employees; worked in their own business, profession, or on their own farm, or worked 15 hours or more as unpaid workers in an enterprise operated by a member of the family; and (b) all those who were not working but who had jobs or businesses from which they were temporarily absent because of vacation, illness, bad weather, childcare problems, maternity or paternity leave, labor-management dispute, job training, or other family or personal reasons, whether or not they were paid for the time off or were seeking other jobs. Each employed person is counted only once, even if he or she holds more than one job. Excluded are persons whose only activity consisted of work around their own house (painting, repairing, or own home housework) or volunteer work for religious, charitable, and other organizations. Unemployed persons: Persons aged 16 years and older who had no employment during the reference week, were available for work, except for temporary illness, and had made specific efforts to find employment sometime during the 4-week period ending with the reference week. Persons who were waiting to be recalled to a job from which they had been laid off need not have been looking for work to be classified as unemployed. Unemployment rate: The unemployment rate represents the number unemployed as a percent of the labor force. Source:US Bureau of Labor Statistics 4