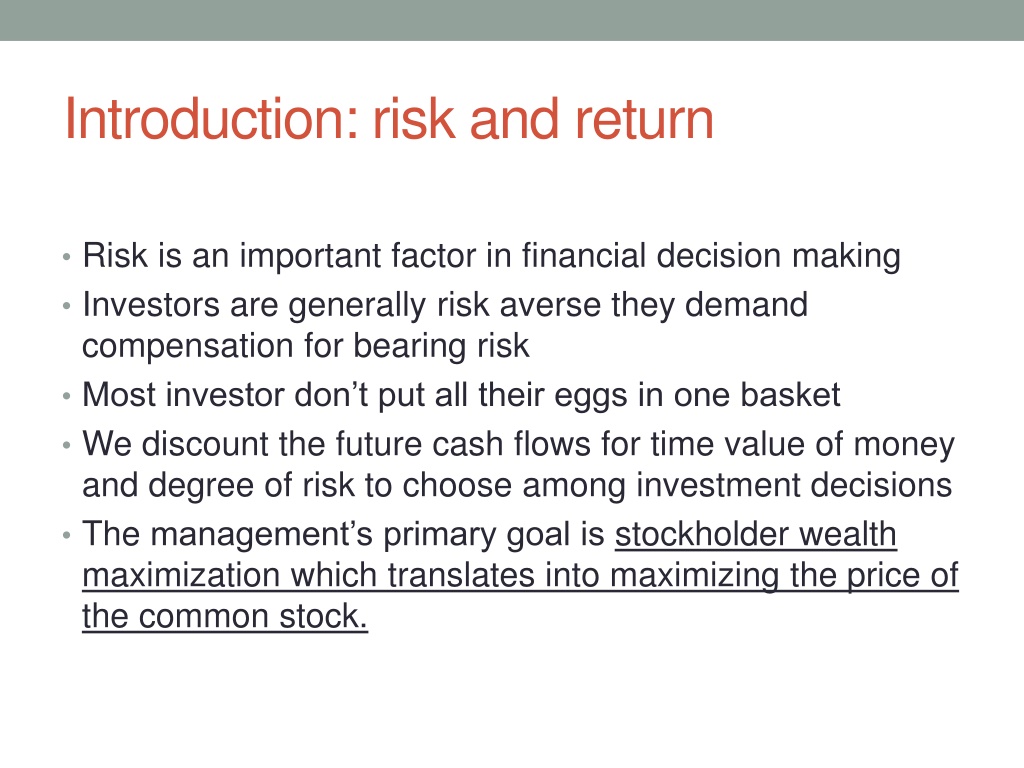
Introduction: risk and return


Introduction: risk and return
•
Risk is an important factor in financial decision making
•
Investors are generally risk averse they demand
compensation for bearing risk
•
Most investor don’t put all their eggs in one basket
•
We discount the future cash flows for time value of money
and degree of risk to choose among investment decisions
•
T
he management’s primary goal is
stockholder wealth
maximization which translates into maximizing the price of
the common stock
.
What is risk ?
•
Risk is the uncertainty of future cash
flow ,it can be measured by the
standard deviation of probability
distribution of stock returns
Systematic risk versus unsystematic risk
•
We can measure risk by dispersion of possible outcomes
around the expected return
•
Total risk =Market risk +Unique risk
•
Unique risk is known as diversifiable risk (unsystematic )
•
Market risk is unavoidable component of risk
R
i
s
k
T
y
p
e
s
The risk (variance) on any individual investment can be broken down into
two sources. Some of the risk is specific to the firm, and is called firm-
specific, whereas the rest of the risk is market wide and affects all
investments.
The risk faced by a firm can be fall into the following categories -
(
1
)
P
r
o
j
e
c
t
-
s
p
e
c
i
f
i
c
;
a
n
i
n
d
i
v
i
d
u
a
l
p
r
o
j
e
c
t
m
a
y
h
a
v
e
h
i
g
h
e
r
o
r
l
o
w
e
r
c
a
s
h
f
l
o
w
s
t
h
a
n
e
x
p
e
c
t
e
d
.
(
2
)
C
o
m
p
e
t
i
t
i
v
e
R
i
s
k
,
w
h
i
c
h
i
s
t
h
a
t
t
h
e
e
a
r
n
i
n
g
s
a
n
d
c
a
s
h
f
l
o
w
s
o
n
a
p
r
o
j
e
c
t
c
a
n
b
e
a
f
f
e
c
t
e
d
b
y
t
h
e
a
c
t
i
o
n
s
o
f
c
o
m
p
e
t
i
t
o
r
s
.
(
3
)
I
n
d
u
s
t
r
y
-
s
p
e
c
i
f
i
c
R
i
s
k
,
w
h
i
c
h
c
o
v
e
r
s
f
a
c
t
o
r
s
t
h
a
t
p
r
i
m
a
r
i
l
y
i
m
p
a
c
t
t
h
e
e
a
r
n
i
n
g
s
a
n
d
c
a
s
h
f
l
o
w
s
o
f
a
s
p
e
c
i
f
i
c
i
n
d
u
s
t
r
y
.
(
4
)
I
n
t
e
r
n
a
t
i
o
n
a
l
R
i
s
k
,
a
r
i
s
i
n
g
f
r
o
m
h
a
v
i
n
g
s
o
m
e
c
a
s
h
f
l
o
w
s
m
e
a
s
u
r
e
d
i
n
c
u
r
r
e
n
c
i
e
s
o
t
h
e
r
t
h
a
n
t
h
e
o
n
e
i
n
w
h
i
c
h
t
h
e
e
a
r
n
i
n
g
s
a
r
e
m
e
a
s
u
r
e
d
(
5
)
M
a
r
k
e
t
r
i
s
k
,
w
h
i
c
h
r
e
f
l
e
c
t
s
t
h
e
e
f
f
e
c
t
o
n
e
a
r
n
i
n
g
s
a
n
d
c
a
s
h
f
l
o
w
s
o
f
m
a
c
r
o
e
c
o
n
o
m
i
c
f
a
c
t
o
r
s
t
h
a
t
e
s
s
e
n
t
i
a
l
l
y
a
f
f
e
c
t
a
l
l
c
o
m
p
a
n
i
e
s
•
In 1987 around 95 %of stocks traded on the New York stock exchange dropped in
price
T
h
e
E
f
f
e
c
t
s
o
f
D
i
v
e
r
s
i
f
i
c
a
t
i
o
n
Firm-specific risk
can be reduced,
if not eliminated, by
increasing
the number of investments in your portfolio
(i.e., by being
diversified).
Market-wide risk cannot. This can be justified on either economic
or statistical grounds.
On economic grounds, diversifying and holding a larger portfolio
eliminates firm-specific risk for two reasons-
(
a
)
E
a
c
h
i
n
v
e
s
t
m
e
n
t
i
s
a
m
u
c
h
s
m
a
l
l
e
r
p
e
r
c
e
n
t
a
g
e
o
f
t
h
e
p
o
r
t
f
o
l
i
o
,
m
u
t
i
n
g
t
h
e
e
f
f
e
c
t
(
p
o
s
i
t
i
v
e
o
r
n
e
g
a
t
i
v
e
)
o
n
t
h
e
o
v
e
r
a
l
l
p
o
r
t
o
l
i
o
.
(
b
)
F
i
r
m
-
s
p
e
c
i
f
i
c
a
c
t
i
o
n
s
c
a
n
b
e
e
i
t
h
e
r
p
o
s
i
t
i
v
e
o
r
n
e
g
a
t
i
v
e
.
I
n
a
l
a
r
g
e
p
o
r
t
f
o
l
i
o
,
i
t
i
s
a
r
g
u
e
d
,
t
h
e
s
e
e
f
f
e
c
t
s
w
i
l
l
a
v
e
r
a
g
e
o
u
t
t
o
z
e
r
o
T
h
e
M
a
r
k
e
t
P
o
r
t
f
o
l
i
o
Assuming
diversification cost nothing
(in terms of transactions cost), and that
all assets can be traded,
the limit of diversification is to hold a portfolio of
every single asset in the economy (in proportion to market value). This
portfolio is called the market portfolio.
Individual investors will adjust for risk, by adjusting their allocations to this
market portfolio and a riskless asset (such as a T-Bill)
Preferred risk level
Allocation decision
No risk
100% in T-Bills
Some risk
50% in T-Bills; 50% in Market Portfolio;
A little more risk
25% in T-Bills; 75% in Market Portfolio
Even more risk
100% Market Portfolio
Highest risk
..
Borrow money; Invest in market portfolio;
Every investor holds some combination of the risk free asset and the market
portfolio.
Market risk and unique risk :
Effect of diversification
Market
risk
Unique
risk
Risk
Number of shares
Market risk and Beta
•
Beta (
β
) measure the sensitivity of a an asset return to
market movement (systematic risk )
•
Estimating beta
: Stocks beta are usually estimated from
historical data based on expectations about future
performance relative to market
R
i
s
k
f
r
e
e
R
a
t
e
On a riskfree asset, the actual return is equal to the expected return.
Therefore, there is no variance around the
mean
.
The riskfree rate is the rate on a zero coupon government bond matching the
time horizon of the cash flow being analyzed.
T
h
e
r
e
h
a
s
t
o
b
e
n
o
d
e
f
a
u
l
t
r
i
s
k
,
w
h
i
c
h
g
e
n
e
r
a
l
l
y
i
m
p
l
i
e
s
t
h
a
t
t
h
e
s
e
c
u
r
i
t
y
h
a
s
t
o
b
e
i
s
s
u
e
d
b
y
t
h
e
g
o
v
e
r
n
m
e
n
t
.
h
o
w
e
v
e
r
,
t
h
a
t
n
o
t
a
l
l
governments can be viewed as default free.
Theoretically, this translates into using different riskfree rates for each cash
flow – the 1 year zero coupon rate for the cash flow in year 1, the 2-year zero
coupon rate for the cash flow in year 2 …
On reality ,there is nothing without bearing risk .
T
h
e
C
a
p
i
t
a
l
A
s
s
e
t
P
r
i
n
c
i
n
g
M
o
d
e
l
Uses variances as a measure of risk
Specifies that a portoin of variance can be diversified away, and that is
only the non-diversifiable portion that is rewarded.
Measures the non-diversifiable risk with beta, which is standardized
around one.
Translates beta into expected return –
Expected Return = Riskfree rate + Beta * Risk Premium
Assumptions of CAPM
•
1-
Efficient market: Securities market is highly competitive
and populated by highly informed buyers and sellers
•
2-Securities market are dominated by rational, risk averse
investors, who seek to maximize their returns and they
demand a premium in the form of higher expected return
from bearing risk
•
3- Financial market are frictionless :there are no tax
,transaction cost or restriction on borrowing and lending
M
e
a
s
u
r
e
m
e
n
t
o
f
t
h
e
r
i
s
k
p
r
e
m
i
u
m
The risk premium is the premium that investors demand for investing in
an average risk investment, relative to the riskfree rate.
As a general proposition, this premium should be
g
r
e
a
t
e
r
t
h
a
n
z
e
r
o
i
n
c
r
e
a
s
e
w
i
t
h
t
h
e
r
i
s
k
a
v
e
r
s
i
o
n
o
f
t
h
e
i
n
v
e
s
t
o
r
s
i
n
t
h
a
t
m
a
r
k
e
t
i
n
c
r
e
a
s
e
w
i
t
h
t
h
e
r
i
s
k
i
n
e
s
s
o
f
t
h
e
„
a
v
e
r
a
g
e
”
r
i
s
k
i
n
v
e
s
t
m
e
n
t
.
E
s
t
i
m
a
t
i
n
g
R
i
s
k
P
r
e
m
i
u
m
s
i
n
P
r
a
c
t
i
c
e
Survey
approach :
investors
asked about
their
desired risk premiums and use the average
premium from these surveys.
Assume that the actual premium delivered
over long time periods is equal to the
expected premium – i.e.,
use historical data
Estimate the
implied premium
in today’s asset
prices
.
h
i
s
t
o
r
i
c
a
l
p
r
e
m
i
u
m
s
a
p
p
r
o
a
c
h
F
or instance Ibbotson estimates the following premiums for major
markets from 1970-1996
C
o
u
n
t
r
y
S
t
o
c
k
r
e
t
u
r
n
B
o
n
d
R
e
t
u
r
n
R
i
s
k
P
r
e
m
i
u
m
Australia
8.47%
6.99%
1.48%
France
11.51%
9.17%
2.34%
Germany
11.30%
12.10%
-0.80%
Italy
5.49%
7.84%
-2.35%
Japan
15.73%
12.69%
3.04%
Mexico
11.88%
10.71%
1.17%
Singapore
15.48%
6.45%
9.03%
Spain
8.22%
7.91%
0.31%
Switzerland
13.49%
10.11%
3.38%
UK
12.42%
7.81%
4.61%
Portfolio Theory and CAPM
Efficient
portfoliós
Std. dev.
Yield
Std. dev.
Yield
Efficient portfolios
after introducing risk free investment
r
f
Beta
Yield
r
f
1
s
p
CML
SML
CAPM
Beta
Portfolio beta
L
i
m
i
t
a
t
i
o
n
s
o
f
t
h
e
C
A
P
M
1.
The model makes unrealistic assumptions
2.
The pareameters of the model cannot be estimated precisely
- Definition of a market index
- Firm may have changed during the ‘estimation’ period’
3.
The model does not work well
- If the model is right, there should be
a linear relationship between returns and betas
the only variable that should explain returns is betas
- The reality is that
the relationship between betas and returns is weak
Other variables (size, price/book value) seem to explain
differences in returns better.
Financial decision making: the capital structure
decision
I
n
v
e
s
t
i
n
p
r
o
j
e
c
t
s
t
h
a
t
y
i
e
l
d
a
r
e
t
u
r
n
g
r
e
a
t
e
r
t
h
a
n
t
h
e
m
i
n
i
m
u
m
a
c
c
e
p
t
a
b
l
e
h
u
r
d
l
e
r
a
t
e
.
T
h
e
h
u
r
d
l
e
r
a
t
e
s
h
o
u
l
d
b
e
h
i
g
h
e
r
f
o
r
r
i
s
k
i
e
r
p
r
o
j
e
c
t
s
a
n
d
r
e
f
l
e
c
t
t
h
e
financing mix
used – owners’ funds (equity) or
borrowed money (debt)
R
e
t
u
r
n
s
o
n
p
r
o
j
e
c
t
s
s
h
o
u
l
d
b
e
m
e
a
s
u
r
e
d
b
a
s
e
d
o
n
c
a
s
h
f
l
o
w
s
g
e
n
e
r
a
t
e
d
a
n
d
t
h
e
t
i
m
i
n
g
o
f
t
h
e
s
e
c
a
s
h
f
l
o
w
s
;
t
h
e
y
s
h
o
u
l
d
a
l
s
o
C
h
o
o
s
e
a
f
i
n
a
n
c
i
n
g
m
i
x
t
h
a
t
m
i
n
i
m
i
z
e
s
t
h
e
h
u
r
d
l
e
r
a
t
e
a
n
d
m
a
t
c
h
e
s
t
h
e
a
s
s
e
t
s
b
e
i
n
g
f
i
n
a
n
c
e
d
.
T
h
e
C
o
s
t
o
f
R
a
i
s
i
n
g
F
u
n
d
s
I
ssuing new equity is much more expensive than
raising new debt for companies that are already
publicly traded, in terms of transactions costs and
investment banking fess.
Raising small amounts is much more expensive than
raising large amounts, for both equity and debt
Weighted average cost of capital
•
WACC:
is the minimum acceptable rate of return at which
a company yields returns for its investors
•
W
A
C
C
i
s
a
n
i
n
v
e
s
t
o
r
’
s
o
p
p
o
r
t
u
n
i
t
y
c
o
s
t
o
f
t
a
k
i
n
g
o
n
t
h
e
r
i
s
k
o
f
i
n
v
e
s
t
i
n
g
m
o
n
e
y
i
n
a
c
o
m
p
a
n
y
•
We used WACC for proper investment decision making
whether or not an investment is worth pursuing
M
e
a
s
u
r
i
n
g
C
o
s
t
o
f
C
a
p
i
t
a
l
I
t
will depend upon:
(a) the components of financing: Debt, Equity or Preferred stock
(b) the cost of each component
the cost of capital is the cost of each component weighted by its relative market
value.
Where,
D : total debt
E : total equity
r : interest rate of debt
r : expected yield of equity
d
e
C
o
s
t
o
f
C
a
p
i
t
a
l
:
u
s
i
n
g
t
h
e
D
i
v
i
d
e
n
d
g
r
o
w
t
h
m
o
d
e
l
C
o
s
t
o
f
C
a
p
i
t
a
l
:
u
s
i
n
g
t
h
e
D
i
v
i
d
e
n
d
g
r
o
w
t
h
m
o
d
e
l
Why we calculate the WACC
•
To assess the value of investments
•
WACC used as a hurdle rate against which companies
and investors can gauge return on investment
•
WACC is also essential to perform economic value-added
(EVA) calculations.
•
WACC used as an indicator of whether or not an
investment is worth pursuing
•
THANK YOU
No free launch
Risk is a significant factor in financial decisions, with investors seeking compensation for bearing uncertainty. This article explores types of risk, systematic vs. unsystematic risk, and the effects of diversification on reducing firm-specific risk. Understanding risk is crucial for maximizing stockholder wealth.

Download Presentation

Please find below an Image/Link to download the presentation.
The content on the website is provided AS IS for your information and personal use only. It may not be sold, licensed, or shared on other websites without obtaining consent from the author. Download presentation by click this link. If you encounter any issues during the download, it is possible that the publisher has removed the file from their server.
E N D
Presentation Transcript
Introduction: risk and return Risk is an important factor in financial decision making Investors are generally risk averse they demand compensation for bearing risk Most investor don t put all their eggs in one basket We discount the future cash flows for time value of money and degree of risk to choose among investment decisions The management s primary goal is stockholder wealth maximization which translates into maximizing the price of the common stock.
What is risk ? Risk is the uncertainty of future cash flow ,it can be measured by the standard deviation of probability distribution of stock returns
Systematic risk versus unsystematic risk We can measure risk by dispersion of possible outcomes around the expected return Total risk =Market risk +Unique risk Unique risk is known as diversifiable risk (unsystematic ) Market risk is unavoidable component of risk
Risk Types The risk (variance) on any individual investment can be broken down into two sources. Some of the risk is specific to the firm, and is called firm- specific, whereas the rest of the risk is market wide and affects all investments. The risk faced by a firm can be fall into the following categories - (1) Project-specific; an individual project may have higher or lower cash flows than expected. (2) Competitive Risk, which is that the earnings and cash flows on a project can be affected by the actions of competitors. (3) Industry-specific Risk, which covers factors that primarily impact the earnings and cash flows of a specific industry. (4) International Risk, arising from having some cash flows measured in currencies other than the one in which the earnings are measured (5) Market risk, which reflects the effect on earnings and cash flows of macro economic factors that essentially affect all companies In 1987 around 95 %of stocks traded on the New York stock exchange dropped in price
The Effects of Diversification Firm-specific risk can be reduced, if not eliminated, by increasing the number of investments in your portfolio (i.e., by being diversified). Market-wide risk cannot. This can be justified on either economic or statistical grounds. On economic grounds, diversifying and holding a larger portfolio eliminates firm-specific risk for two reasons- (a) Each investment is a much smaller percentage of the portfolio, muting the effect (positive or negative) on the overall portolio. (b) Firm-specific actions can be either positive or negative. In a large portfolio, it is argued, these effects will average out to zero
The Market Portfolio Assuming diversification cost nothing (in terms of transactions cost), and that all assets can be traded, the limit of diversification is to hold a portfolio of every single asset in the economy (in proportion to market value). This portfolio is called the market portfolio. Individual investors will adjust for risk, by adjusting their allocations to this market portfolio and a riskless asset (such as a T-Bill) Preferred risk level Allocation decision No risk 100% in T-Bills Some risk 50% in T-Bills; 50% in Market Portfolio; A little more risk 25% in T-Bills; 75% in Market Portfolio Even more risk 100% Market Portfolio Highest risk.. Borrow money; Invest in market portfolio; Every investor holds some combination of the risk free asset and the market portfolio.
Market risk and unique risk :Effect of diversification Risk Unique risk Market risk Number of shares
Market risk and Beta Beta ( ) measure the sensitivity of a an asset return to market movement (systematic risk ) Estimating beta : Stocks beta are usually estimated from historical data based on expectations about future performance relative to market
Riskfree Rate On a riskfree asset, the actual return is equal to the expected return. Therefore, there is no variance around the mean. The riskfree rate is the rate on a zero coupon government bond matching the time horizon of the cash flow being analyzed. There has to be no default risk, which generally implies that the security has to be issued by the government. however, that not all governments can be viewed as default free. Theoretically, this translates into using different riskfree rates for each cash flow the 1 year zero coupon rate for the cash flow in year 1, the 2-year zero coupon rate for the cash flow in year 2 On reality ,there is nothing without bearing risk .
The Capital Asset Princing Model Uses variances as a measure of risk Specifies that a portoin of variance can be diversified away, and that is only the non-diversifiable portion that is rewarded. Measures the non-diversifiable risk with beta, which is standardized around one. Translates beta into expected return Expected Return = Riskfree rate + Beta * Risk Premium
Assumptions of CAPM 1-Efficient market: Securities market is highly competitive and populated by highly informed buyers and sellers 2-Securities market are dominated by rational, risk averse investors, who seek to maximize their returns and they demand a premium in the form of higher expected return from bearing risk 3- Financial market are frictionless :there are no tax ,transaction cost or restriction on borrowing and lending
Measurement of the risk premium The risk premium is the premium that investors demand for investing in an average risk investment, relative to the riskfree rate. As a general proposition, this premium should be greater than zero increase with the risk aversion of the investors in that market increase with the riskiness of the average risk investment.
Estimating Risk Premiums in Practice Survey approach :investors asked about their desired risk premiums and use the average premium from these surveys. Assume that the actual premium delivered over long time periods is equal to the expected premium i.e., use historical data Estimate the implied premium in today s asset prices.
historical premiums approach For instance Ibbotson estimates the following premiums for major markets from 1970-1996 Country Australia France Germany Italy Japan Mexico Singapore Spain Switzerland UK Stock return 8.47% 11.51% 11.30% 5.49% 15.73% 11.88% 15.48% 8.22% 13.49% 12.42% Bond Return 6.99% 9.17% 12.10% 7.84% 12.69% 10.71% 6.45% 7.91% 10.11% 7.81% Risk Premium 1.48% 2.34% -0.80% -2.35% 3.04% 1.17% 9.03% 0.31% 3.38% 4.61%
Portfolio Theory and CAPM Efficient portfoli s Efficient portfolios after introducing risk free investment CML Yield Yield Yield SML rf rf sp Std. dev. Std. dev. 1 Beta Beta CAPM Portfolio beta n w = 1 ( ) ( ) , COV x M = = + r r r r i = p i i i f m f i 2 i s M
Limitations of the CAPM The model makes unrealistic assumptions The pareameters of the model cannot be estimated precisely - Definition of a market index - Firm may have changed during the estimation period The model does not work well - If the model is right, there should be a linear relationship between returns and betas the only variable that should explain returns is betas - The reality is that the relationship between betas and returns is weak Other variables (size, price/book value) seem to explain differences in returns better. 1. 2. 3.
Financial decision making: the capital structure decision Invest in projects that yield a return greater than the minimum acceptable hurdle rate. The hurdle rate should be higher for riskier projects and reflect the financing mix used owners funds (equity) or borrowed money (debt) Returns on projects should be measured based on cash flows generated and the timing of these cash flows; they should also Choose a financing mix that minimizes the hurdle rate and matches the assets being financed.
The Cost of Raising Funds Issuing new equity is much more expensive than raising new debt for companies that are already publicly traded, in terms of transactions costs and investment banking fess. Raising small amounts is much more expensive than raising large amounts, for both equity and debt
Weighted average cost of capital WACC: is the minimum acceptable rate of return at which a company yields returns for its investors WACC is an investor s opportunity cost of taking on the risk of investing money in a company We used WACC for proper investment decision making whether or not an investment is worth pursuing
Measuring Cost of Capital It will depend upon: (a) the components of financing: Debt, Equity or Preferred stock (b) the cost of each component the cost of capital is the cost of each component weighted by its relative market value. E + D + = + WACC r r e d D E D E Where, D : total debt E : total equity r : interest rate of debt r : expected yield of equity d e
Cost of Capital: using the Dividend growth model The cost of debt is the market interest rate that the firm has to pay on it`s borrowing. It will depend upon three components (a) The general level of interest rates (b) The default premium (c) The firm s tax rate ??= ??1 ?? ?
Cost of Capital: using the Dividend growth model The cost of equity is: 1. the required rate of return given the risk 2. inclusive of both dividend yield and price appreciation ??=??? ?+ ? =??? 1+? + ? ?
Why we calculate the WACC To assess the value of investments WACC used as a hurdle rate against which companies and investors can gauge return on investment WACC is also essential to perform economic value-added (EVA) calculations. WACC used as an indicator of whether or not an investment is worth pursuing