Interpreting Pictograms for Problem Solving
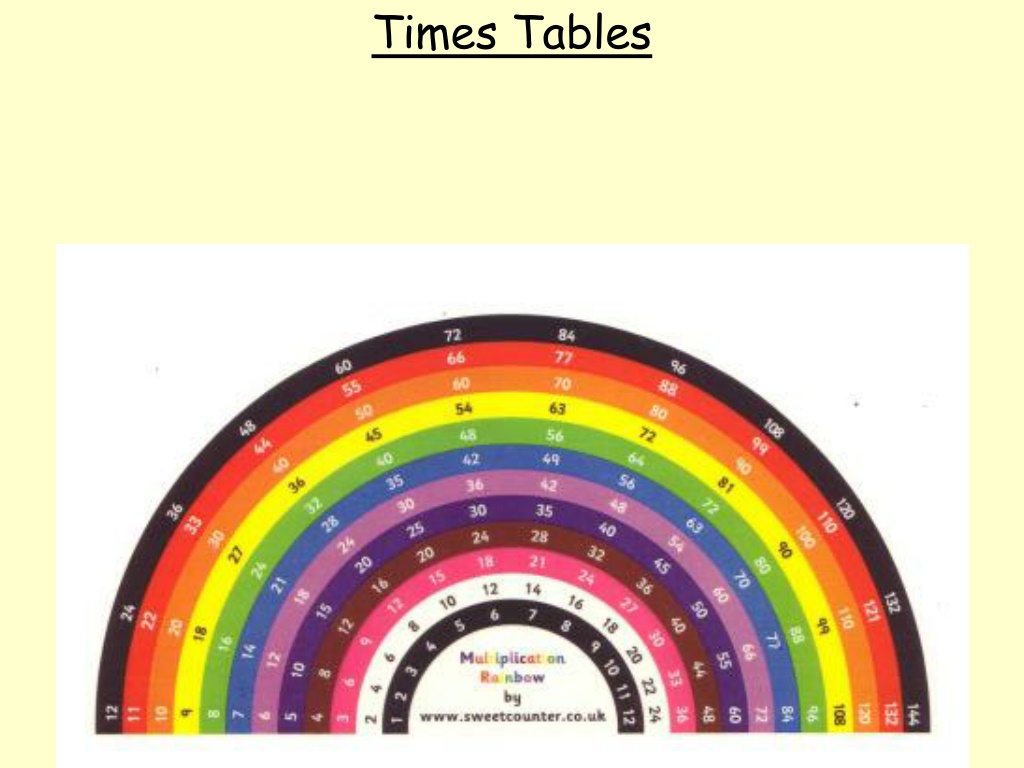
Times Tables
01
.03.21
How do I read and interpret pictograms?
•
D – Using values of 1, 2, 5 or 10. No half pictures
(SA)
•
E – Using various values. Some pictograms include
half pictures (SA)
•
GD – Using commutative law to calculate a wider
range of multiplication facts. Some pictograms
include half and quarter pictures (SA)
•
Solve problems
Footballs / Chocolate eggs (TM)
Vocabulary
Statistics, data, pictogram, symbols, represent,
interpret, values, key, most, least, difference
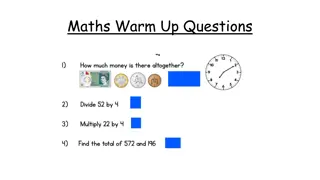
Fluency input
Something a bit different for input today. Have a
look through the BBC Bitesize link below. It will
remind you about pictograms from last week and
there is also a quiz to have a go at towards the end.
You can then move onto today’s Fluency questions.
https://www.bbc.co.uk/bitesize/articles/z493hcw
Fluency
Fluency (Extension)
Reasoning and Problem Solving
01
.03.21
How do I read and interpret pictograms?
•
D – Using values of 1, 2, 5 or 10. No half pictures
(SA)
•
E – Using various values. Some pictograms include
half pictures (SA)
•
GD – Using commutative law to calculate a wider
range of multiplication facts. Some pictograms
include half and quarter pictures (SA)
•
Solve problems
Footballs / Chocolate eggs (TM)
Plenary
Reasoning and Problem Solving
Discuss and Answer
Delve into the world of pictograms to solve interesting problems and sharpen your reasoning skills. Explore different values, analyze data, and create your own pictograms for a hands-on learning experience. Challenge yourself with fluency exercises and enhance your understanding of statistics, data interpretation, and multiplication concepts.

Download Presentation

Please find below an Image/Link to download the presentation.
The content on the website is provided AS IS for your information and personal use only. It may not be sold, licensed, or shared on other websites without obtaining consent from the author.If you encounter any issues during the download, it is possible that the publisher has removed the file from their server.
You are allowed to download the files provided on this website for personal or commercial use, subject to the condition that they are used lawfully. All files are the property of their respective owners.
The content on the website is provided AS IS for your information and personal use only. It may not be sold, licensed, or shared on other websites without obtaining consent from the author.
E N D
Presentation Transcript
01.03.21 How do I read and interpret pictograms? D Using values of 1, 2, 5 or 10. No half pictures (SA) E Using various values. Some pictograms include half pictures (SA) GD Using commutative law to calculate a wider range of multiplication facts. Some pictograms include half and quarter pictures (SA) Solve problems Footballs / Chocolate eggs (TM)
Vocabulary Statistics, data, pictogram, symbols, represent, interpret, values, key, most, least, difference
Fluency input Something a bit different for input today. Have a look through the BBC Bitesize link below. It will remind you about pictograms from last week and there is also a quiz to have a go at towards the end. You can then move onto today s Fluency questions. https://www.bbc.co.uk/bitesize/articles/z493hcw
Fluency E D GD 1) Complete the missing sections of the pictogram using the information below. 1) Complete the missing sections of the pictogram using the information below. Answer the questions about the ice cream treats sold at a tuck shop. A. 9 fewer children walk to school than come by car. B. Double the number of children who cycle take the bus. C. 3 times as many children take the taxi than cycle. A. 14 Children like slightly salted flavoured crisps. B. 4 fewer children like pickled onion crisps than slightly salted crisps. C. 8 fewer children like beef crisps than chilli crisps. 1) How many sugar cones were sold? 2) Which two items were equally sold? 3) How many fewer bowls were sold than wafer cones?
Fluency (Extension) Create your own pictogram. - Think about the Knowledge and Skills and what you re hoping to achieve this lesson. Ideas: You could count the colour of cars that pass your home and turn the data into a pictogram You could count the stationery that you have at home and turn the data into a pictogram. You could select some of the data that we collected as a year group. Or make a pictogram of your own
01.03.21 How do I read and interpret pictograms? D Using values of 1, 2, 5 or 10. No half pictures (SA) E Using various values. Some pictograms include half pictures (SA) GD Using commutative law to calculate a wider range of multiplication facts. Some pictograms include half and quarter pictures (SA) Solve problems Footballs / Chocolate eggs (TM)
Plenary Reasoning and Problem Solving Discuss and Answer


")