Inspection Profiles of Largest Children's Homes Providers - August 2018
Explore the inspection profiles of the largest private and voluntary providers of children's homes as of August 2018. Gain insights into ownership and inspection outcomes of over 500 homes, highlighting key organizations and national comparisons. Dive into the varying inspection profiles and outcomes across different providers in the sector.
Uploaded on Sep 24, 2024 | 2 Views
Download Presentation

Please find below an Image/Link to download the presentation.
The content on the website is provided AS IS for your information and personal use only. It may not be sold, licensed, or shared on other websites without obtaining consent from the author.If you encounter any issues during the download, it is possible that the publisher has removed the file from their server.
You are allowed to download the files provided on this website for personal or commercial use, subject to the condition that they are used lawfully. All files are the property of their respective owners.
The content on the website is provided AS IS for your information and personal use only. It may not be sold, licensed, or shared on other websites without obtaining consent from the author.
E N D
Presentation Transcript
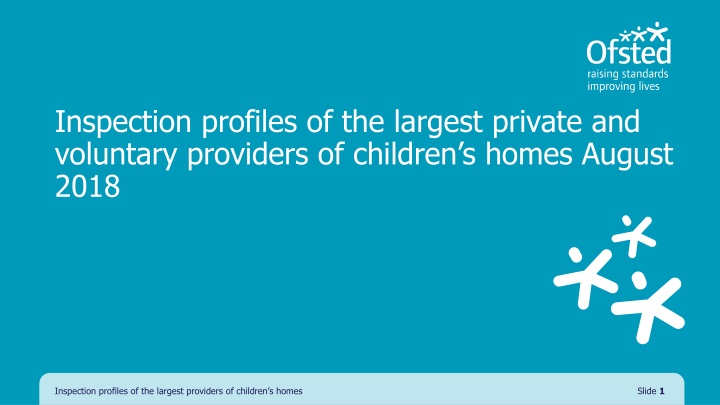
Inspection profiles of the largest private and voluntary providers of children s homes August 2018 Inspection profiles of the largest providers of children s homes Slide 1
The largest providers of childrens homes In our blog post, The changing picture in the children s home sector, we explained that we wanted to understand more about private and voluntary sector ownership of children s homes. To help us gain this understanding, we have identified the largest providers of children s homes. As at 31 August 2018, these providers owned over 500 children s homes just over 30% of all private and voluntary children s homes. The vast majority of these children s homes had been inspected by 31 August 2018. We have taken our data at this point in time to provide the inspection outcome picture for each organisation. These slides cover only inspection profiles, and don't feature any other characteristics of these homes or the wider factors that local authorities take into account when placing a child in a children s home. Inspection profiles of the largest providers of children s homes Slide 2
Inspection profiles of the largest organisations As at 31 August 2018, the inspection profiles of the largest private and voluntary organisations that own children s homes were as follows: N.B. This is a snapshot of the end of August only. Some children s homes may have improved or declined since this date. 1. 2. 3. Data is based on private and voluntary children's homes that had been inspected as at 31 August 2018, with their reports published as at 30 September 2018. Figures in bracket indicate the number of homes for each company. Some homes owned by these organisations are new and have yet to have their first inspection. Percentages may not sum to 100 due to rounding. Inspection profiles of the largest providers of children s homes Slide 3
National view of private and voluntary organisations The previous slide shows that the inspection profiles vary between the largest organisations. However, when we compare children s homes owned by the largest organisations to all private and voluntary children s homes nationally, we can see that their outcomes are similar: N.B. This is a snapshot of the end of August only. Some children s homes may have improved or declined since this date. 1. 2. Data is based on private and voluntary children's homes that had been inspected as at 31 August 2018 and published as at 30 September 2018. Percentages may not sum to 100 due to rounding. Inspection profiles of the largest providers of children s homes Slide 4
Ofsted on the web and on social media www.gov.uk/ofsted https://reports.ofsted.gov.uk www.linkedin.com/company/ofsted www.youtube.com/ofstednews www.slideshare.net/ofstednews www.twitter.com/ofstednews Inspection profiles of the largest providers of children s homes Slide 5
