Insights into the Gaming Landscape in Finland
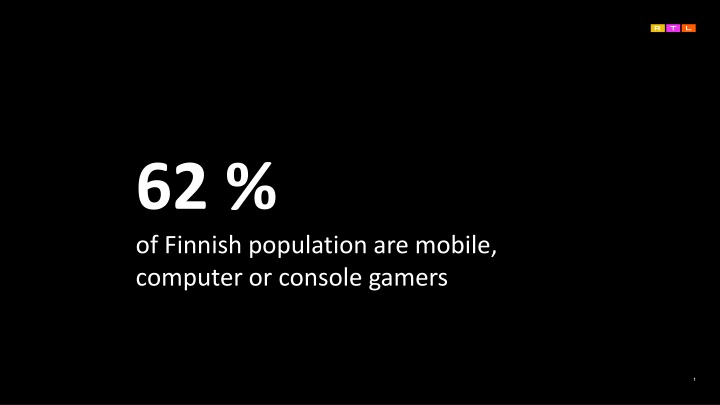
The data reveals that 62% of the Finnish population are mobile, computer, or console gamers, with 62% of mobile gamers being women. Detailed profiles of gamers based on gender, age, and device usage are provided, along with information on mobile gaming frequency and preferences. Additionally, a demographic profile of mobile gamers in Finland is presented, highlighting their gender, age distribution, household income, and phone system usage.
Download Presentation

Please find below an Image/Link to download the presentation.
The content on the website is provided AS IS for your information and personal use only. It may not be sold, licensed, or shared on other websites without obtaining consent from the author.If you encounter any issues during the download, it is possible that the publisher has removed the file from their server.
You are allowed to download the files provided on this website for personal or commercial use, subject to the condition that they are used lawfully. All files are the property of their respective owners.
The content on the website is provided AS IS for your information and personal use only. It may not be sold, licensed, or shared on other websites without obtaining consent from the author.
E N D
Presentation Transcript
62 % of Finnish population are mobile, computer or console gamers 1
62 % of mobile gamers are women 2
Gamer profiles Mobile gamers (n=351, 70%) E-sport followers (n=54, 10%) Console gamers (n=177, 35%) Computer gamers (n=242, 48%) 0% 25% 50% 75% 100% 0% 25% 50% 75% 100% 0% 25% 50% 75% 100% 0% 25% 50% 75% 100% Men Men 38% 58% Men 55% Men 76% Women Women 62% 42% Women 44% Women 24% 18-24 yo 18-24 yo 15% 11% 18-24 yo 18% 18-24 yo 14% 25-34 yo 25-34 yo 24% 26% 25-34 yo 35% 25-34 yo 42% 35-44 yo 35-44 yo 21% 19% 35-44 yo 26% 35-44 yo 28% 45-54 yo 45-54 yo 18% 15% 45-54 yo 16% 45-54 yo 14% 55-64 yo 55-64 yo 12% 14% 55-64 yo 3% 55-64 yo 2% 65-74 yo 65-74 yo 10% 16% 65-74 yo 2% 65-74 yo 0% iPhone users iPhone users 28% 18% iPhone users 26% iPhone users 27% Android users Android users 72% 78% Android users 73% Android users 73% Quoestion: Which of the following includes your free time activities? Kysymys: Mitk seuraavista kuuluvat vapaa-ajanviettotapoihisi? 3
43 % of total population Est. 1 693000 MOBILE GAMER: demographic PROFILE Gender Age Life situation Place of residence 19% 15% Capital area 18-24 24% 25-34 Other city over 100 000 people 29% Couple 31% (36 %) Single 31% (37 %) 21% 35-44 50 000 - 99 000 people city 17% 38 % 62 % (51 %) 18% 45-54 (49 %) 20 000 - 49 999 people town 18% 12% 55-64 Live with parents (over 18 yo) 4% (3%) Family 32% (23 %) Rural area under 20 000 people 10% 65-74 17% Gaming Profession Household income Phone system in use 10% Director, upper white collar 100% 19% Mobile Under 20.000 72% Android phone 11% White collar worker, lower 35% Computer 16% 20.000 - 35.000 2% Entrepreneur 31% Blue collar worker 34% 28% Console 17% iPhone 35.001 - 50 000 17% Retired 10% E-sports 16% 15% Student 50.001 - 70.000 0% None of these Other 3% 0% Other 17% Over 70.000 11% Unemployed Total population (starting sample, n=811) Mobile gamers (n=351) 4
Mobile games are played more frequently 47 % Being daily gamers 5
Gaming frequency 0% 25% 50% 75% 100% Mobile games are played most frequently, 47 % being daily gamers. Mobile games 47% 21% 15% 6% 4% 3% 4% Console games are also played mostly at least couple of times a week. Computer games 30% 23% 17% 9% 4% 10% 8% Compared to mobile and computer games console games are played less frequently. Console games 14% 22% 19% 13% 6% 17% 9% Daily Once a week Less frequent Several times a week Every other week Couple of times a week Once a month 6 Quoestion: How often do you play these games? Kysymys: Kuinka usein yleens pelaat n it pelej ? Base: mobile gamers n=351, console gamers n=177, computer gamers n=242
77% Play for relaxation 7
Typical reasons for gaming 0% 25% 50% 75% 100% Relaxation 77% The most typical reasons for gaming are need for relaxation, feeling bored or waiting time to fly. Feeling bored 51% Waiting time to fly 46% Development in gaming 19% Social aspect (playing with others) 18% Competing, winning others 12% Other 2% 8 Quoestion: Which of the following things are typical reasons for your own gaming? Kysymys: Mitk seuraavista asioista ovat tyypillisi syit omalle pelaamisellesi? Base: total n=500
Emotions aroused while gaming 0% 25% 50% 75% 100% Focused Gaming arouse more positive emotions such as relaxed, exited and comfortable compared to negative emotions like frustrated, annoyed or nervous. 54% Relaxed 53% Normal 40% Excited 35% Comfortable 34% Curious 16% Frustrated 8% Annoyed 6% Nervous 6% Other 0% 9 Quoestion: Which of the following describe best your emotions when gaming? Kysymys: Mitk seuraavista tunteista kuvaavat tyypillist olotilaasi pelatessasi? Base: total n=500
78% remembers seeing video advertising while playing mobile games 10
43 % of total population Est. 1 693000 Mobile gamer profile Time of the day when gaming Reasons for gaming Playing frequency Time spent with mobile gaminig Relaxation 77% Morning 29 % Under 5 minutes 4% Once a week or less 16 % Feeling bored 59% 5-15 min 28% Day time 35 % Waiting for time to fly 53% 16-30 min 30% Daily 47 % Afternoon 54 % 31-45 min 15% Development in gaming 18% Several/couple of times a week 36 % 46-60 min 10% Evening 81 % Social aspect (playing with others) 17% 1-2 hours 9% Night 21 % Competing, winning others 12% Over 2 hours 5% Top 5 areas of interest Desired video ads Frequency of Watching ads Ad recall 38% Rewarded video ads 65 % Movies Advertising of products and brands suitable for me 24% Almost always 21% 78 % 65 % News 14% Informative advertising Now and then 38% 64 % Music 11% Gaming advertising Advertising of many different brands Seldom 25% 60 % Entertainment 10% Remembers seeing video ads while gaming 1% 59 % Food and cooking Something else Never 16% 60% Want to see ads (net) Base: mobile gamers (n=351) 11


