Insights into HIV and AIDS Data Hub for Asia-Pacific
Explore the latest HIV and AIDS data from the Asia-Pacific region, including socio-demographic indicators, prevalence, epidemiology, and national responses. Learn about population statistics, health expenditure, and trends in HIV infections over time.
Download Presentation

Please find below an Image/Link to download the presentation.
The content on the website is provided AS IS for your information and personal use only. It may not be sold, licensed, or shared on other websites without obtaining consent from the author. If you encounter any issues during the download, it is possible that the publisher has removed the file from their server.
You are allowed to download the files provided on this website for personal or commercial use, subject to the condition that they are used lawfully. All files are the property of their respective owners.
The content on the website is provided AS IS for your information and personal use only. It may not be sold, licensed, or shared on other websites without obtaining consent from the author.
E N D
Presentation Transcript
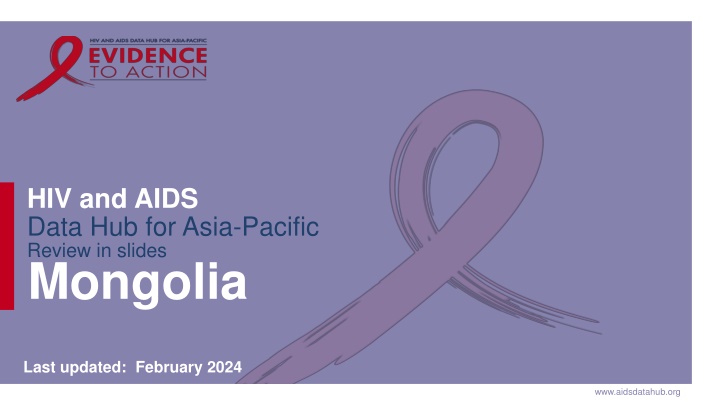
HIV and AIDS Data Hub for Asia-Pacific Review in slides Mongolia Last updated: February 2024 www.aidsdatahub.org
HIV and AIDS Data Hub for Asia-Pacific CONTENT Basic socio-demographic indicators HIV prevalence and epidemiological status Risk behaviors Vulnerability and HIV knowledge HIV expenditure National response 2
HIV and AIDS Data Hub for Asia-Pacific BASIC SOCIO-DEMOGRAPHIC INDICATORS Total population (in thousands) 2,959 (2015) 1 Population aged 15-49 (thousands) 1,672 (2015) 1 Maternal mortality ratio (per 100 000 live births) 44 (2015) 5 Percentage of population in urban areas 72 (2015) 2 Antenatal care coverage - At least one visit (%) 98.7 (2013) 7 Crude birth rate (births per 1,000 population) 23.9 (2014) 2 Under-5 mortality rate (per 1,000 live births) 22 (2015) 2 Human development index (HDI) - Rank/Value 90/0.727 (2014) 4 Life expectancy at birth (years) - Male/Female 65/73 (2015) 5 Adult literacy rate (%) Ratio of girls to boys enrolled at primary level in public and private school (%) GDP per capita (PPP, current international $) 98 (2010) 2 0.98 (2014) 2 12,189 (2015) 2 Per capita total expenditure on health (PPP int. $) 530 (2012) 3 Sources: Prepared by www.aidsdatahub.org based on 1. UN Population Division. (2015). World Population Prospects: The 2015 Revision - Extended Dataset; 2. World Bank. World Data Bank: World Development Indicators & Global Development Finance. Retrieved July 2016, from http://data.worldbank.org/; 3. WHO. (2015). World Health Statistics 2015; 4. Palanivel, T., Mirza, T., Tiwari, B. N., Standley, S., & Nigam, A. (2016). Asia-Pacific Human Development Report - Shaping the Future: How Changing Demographics Can Power Human Development; 5. WHO. (2016). World Health Statistics 2016: Monitoring health for the SDGs; 6. World Bank Group. (2016). World Development Indicators 2016 and 7. UNSD. Millennium Development Goals Database - Antenatal Care Coverage Retrieved May 2016, from http://data.un.org/Data.aspx?q=Antenatal+care+coverage&d=MDG&f=seriesRowID%3a762.
HIV prevalence and epidemiology www.aidsdatahub.org
HIV and AIDS Data Hub for Asia-Pacific Estimated people living with HIV, new HIV infections and AIDS- related deaths, 1990-2022 800 700 630 600 500 Number 400 300 200 100 <100 <100 2022 - 1990 1991 1992 1993 1994 1995 1996 1997 1998 1999 2000 2001 2002 2003 2004 2005 2006 2007 2008 2009 2010 2011 2012 2013 2014 2015 2016 2017 2018 2019 2020 2021 PLHIV New HIV infections AIDS-related deaths 5 Source: Prepared by www.aidsdatahub.org based on UNAIDS HIV estimates 2023
HIV and AIDS Data Hub for Asia-Pacific Estimated number of adults (15+) living with HIV and women (15+) living with HIV, 1990-2022 800 700 630 600 500 Number 400 300 200 <200 100 - 2008 2017 1990 1991 1992 1993 1994 1995 1996 1997 1998 1999 2000 2001 2002 2003 2004 2005 2006 2007 2009 2010 2011 2012 2013 2014 2015 2016 2018 2019 2020 2021 2022 Adults (15+) living with HIV Women (15+) living with HIV 6 Source: Prepared by www.aidsdatahub.org based on UNAIDS HIV estimates 2023
HIV and AIDS Data Hub for Asia-Pacific Key population size estimates, 2021-2022 Key population size estimates Populations Estimate Year of estimate Female sex workers (FSW) 7333 2022 Men who have sex with men (MSM) 7481 2022 Transgender (TG) (Ulaanbaatar) 800 2021 7 Source: Prepared by www.aidsdatahub.org based on Global AIDS Monitoring and National Center for Communicable Diseases, Mongolia (2023). Population size estimation of female sex workers and men who have sex with men in Mongolia, 2022
HIV and AIDS Data Hub for Asia-Pacific HIV prevalence among key populations, 2022 National 5.7 TRANSGENDER PEOPLE (2022) Ulaanbaatar 6.8 National 5.6 MEN WHO HAVE SEX WITH MEN (2022) Darkhan 15.3 National ... PEOPLE WHO INJECT DRUGS City ... National 0 FEMALE SEX WORKERS (2022) Ulaanbaatar 0 8 Source: Prepared by www.aidsdatahub.org based on Serological surveys and Global AIDS Monitoring
HIV and AIDS Data Hub for Asia-Pacific HIV prevalence among key populations, 2007-2022 20 % 13.7 15 10 7.7 5.7 5.6 5 1.8 0 2007 2009 2012 * 2014* 2017 2019 2021 2022 MSM (National) MSM (Ulaanbaatar) Transgender FSW 2012 & 2014 surveys in used a different methodology and data should be interpreted with caution when the results are compared with earlier rounds 9 Source: Prepared by www.aidsdatahub.org based on 1) Second Generation HIV and STI Surveillance Report s; 2) HIV/STI Surveillance Survey 2014 cited in Mongolia Global AIDS Response Progress Report 2015 (Country Narrative Report); 3 Global AIDS Monitoring (GAM) and 4) IBBS 2019, 2021 and 2022
HIV and AIDS Data Hub for Asia-Pacific Syphilis prevalence among key populations and other surveyed populations, 2009-2022 50 % 40 30 28 30 24 18 20 16 15 12 12 10 7 10 7 5 4 0 2009 2012 2014 2019 2022 MSM FSW Transgender Male STI clients Mobile men 10 Source: Prepared by www.aidsdatahub.org based on 1) Global HIV/AIDS Response - Epidemic Update and Health Sector Progress Towards Universal Access - Progress Report, 2011; 2) Second Generation Surveillance Surveys cited in Mongolia Global AIDS Response Progress Report 2015 (Country Narrative Report); and IBBS 2022
HIV and AIDS Data Hub for Asia-Pacific Syphilis prevalence among female sex workers and men who have sex with men by survey location, 2022 50 % 40 30 20 20 12.3 12.1 12.1 11.5 10.6 9.1 9 10 0 Darkhan-Uul Dornod Khuvsgul Ulaanbaatar Total Ulaanbaatar Darkhan-Uul Total Female sex workers Men who have sex with men 11 Source: Prepared by www.aidsdatahub.org based on National Center for Communicable Diseases, Mongolia (2022). Integrated biological and behavioral survey among high-risk population in Mongolia, 2022
HIV and AIDS Data Hub for Asia-Pacific Annual and cumulative reported HIV cases, 1992 Mar 2023 HIV cases AIDS cases Annual HIV cases 12 Source: Prepared by www.aidsdatahub.org based National Center for Communicable Diseases, Mongolia (2023). Dr J Davaakham - The current situation of STI and HIV/AIDS in Mongolia
HIV and AIDS Data Hub for Asia-Pacific Cumulative HIV cases among males by population, 2023 2% 13% Heterosexual men 24% 309 Men who have sex with men of cumulative reported HIV cases Bisexual men Transgender 61% 13 Source: Prepared by www.aidsdatahub.org based National Center for Communicable Diseases, Mongolia (2023). Dr J Davaakham - The current situation of STI and HIV/AIDS in Mongolia
HIV and AIDS Data Hub for Asia-Pacific Reported STI cases, 2013 2023 20000 15000 3827 10000 4519 5000 5912 0 2013 2014 2015 2016 2017 2018 2019 2020 2021 2022 2023 Average of 10 years Syphilis Gonorrhea Trichomoniasis 14 Source: Prepared by www.aidsdatahub.org based National Center for Communicable Diseases, Mongolia (2023). Dr J Davaakham - The current situation of STI and HIV/AIDS in Mongolia
Risk behaviours www.aidsdatahub.org
HIV and AIDS Data Hub for Asia-Pacific Trends in condom use at last sex among key populations, 2007-2022 Female sex workers Men who have sex with men Transgender % 100 92 90 89 80 87 84 83 81 81 81 79 78 77 73 70 67 60 40 20 0 2007 2009 2012 2014 2016 2019 2021 2022 16 Source: Prepared by www.aidsdatahub.org based on 1) Ministry of Health and NCCD. (2012). Second Generation HIV and STI surveillance Report, 2012. Mongolia; 2) Mongolia Global AIDS Response Progress Report 2015 (Country Narrative Report); 3) Global AIDS Monitoring (GAM) and 4) National Center for Communicable Diseases, Mongolia (2022). Integrated biological and behavioral survey among high-risk population in Mongolia, 2022
HIV and AIDS Data Hub for Asia-Pacific Proportion of female sex workers who reported condom use with their clients, 2022 100 % 87 80 60 54 40 20 0 Ulaanbaatar Darkhan-Uul Dornod Khuvsgul Mongolia condom use at last sex consistent condom use 17 Source: Prepared by www.aidsdatahub.org based on National Center for Communicable Diseases, Mongolia (2022). Integrated biological and behavioral survey among high-risk population in Mongolia, 2022
HIV and AIDS Data Hub for Asia-Pacific Proportion of men who have sex with men who reported condom use at last sex by partner type, 2022 % 100 75 72 69 64 0 with male client with regular male with male sex worker with female partner partner Mongolia Ulaanbaatar Darkhan-Uul 18 Source: Prepared by www.aidsdatahub.org based on National Center for Communicable Diseases, Mongolia (2022). Integrated biological and behavioral survey among high-risk population in Mongolia, 2022
HIV and AIDS Data Hub for Asia-Pacific Proportion of men who have sex with men who reported consistent condom use in the last 12 months by partner type, 2022 % 100 69 67 46 37 0 with male clients with regular male with male sex workers with female partners partners Mongolia Ulaanbaatar Darkhan-Uul 19 Source: Prepared by www.aidsdatahub.org based on National Center for Communicable Diseases, Mongolia (2022). Integrated biological and behavioral survey among high-risk population in Mongolia, 2022
HIV and AIDS Data Hub for Asia-Pacific Proportion of transgender women who reported condom use at last sex by partner type, 2022 100 % 91 87 83 79 0 Condom use at last anal sex with a male client with a casual partner with a regular partner 20 Source: Prepared by www.aidsdatahub.org based on National Center for Communicable Diseases, Mongolia (2022). Integrated biological and behavioral survey among high-risk population in Mongolia, 2022
HIV and AIDS Data Hub for Asia-Pacific Proportion of transgender women who reported consistent condom use in the last 12 months by partner type, 2022 100 % 74 62 40 0 with male clients with casual male partners with regular male partners 21 Source: Prepared by www.aidsdatahub.org based on National Center for Communicable Diseases, Mongolia (2022). Integrated biological and behavioral survey among high-risk population in Mongolia, 2022
Vulnerability and HIV knowledge www.aidsdatahub.org
HIV and AIDS Data Hub for Asia-Pacific Proportion of key populations, mobile men and male STI patients with comprehensive HIV knowledge, 2005-2022 % 100 80 60 41 40 2024 18 20 0 2005 2007 2009 2012 2014 2017 2022 Female sex workers Men who have sex with men Mobile men Male STI patients Source: Prepared by www.aidsdatahub.org based on 1. Ministry of Health Mongolia, WHO, et al. (2008). Second Generation HIV/STI Surveillance Report, 2007 Mongolia. 2. Preliminary Data from Second Generation Sentinel Surveillance 2009 cited in National Committee on HIV/AIDS. (2010). UNGASS Country Progress Report: Mongolia; 3. Ministry of Health and NCCD. (2012). Second Generation HIV and STI surveillance Report 2012; and 4 National Center for Communicable Diseases, Mongolia (2022). Integrated biological and behavioral survey among high-risk population in Mongolia, 2022 23
HIV and AIDS Data Hub for Asia-Pacific Proportion of key populations who have heard about PrEP, 2022 100 % 68 58 52 22 0 Mongolia Ulaanbaatar Darkhan-Uul 24 Source: Prepared by www.aidsdatahub.org based on National Center for Communicable Diseases, Mongolia (2022). Integrated biological and behavioral survey among high-risk population in Mongolia, 2022
HIV and AIDS Data Hub for Asia-Pacific Key populations who avoided seeking healthcare in the last 12 months due to fear of stigma and discrimination, 2022 100 75 Percent 50 38 26 19 25 0 Transgender Female sex workers Men who have sex with men Total <25 yr 25+ yr 25 Source: Prepared by www.aidsdatahub.org based on National Center for Communicable Diseases, Mongolia (2022). Integrated biological and behavioral survey among high-risk population in Mongolia, 2022
HIV expenditure www.aidsdatahub.org
HIV and AIDS Data Hub for Asia-Pacific AIDS financing, 2021 AIDS spending by financing source AIDS spending by service category Other AIDS expenditures 31% Domestic funding 48% Key populations prevention 25% 2.5 million US$ Other prevention 4% International funding 52% Care and treatment 40% 27 Source: Prepared by www.aidsdatahub.org based on UNAIDS HIV Financial Dashboard
HIV and AIDS Data Hub for Asia-Pacific AIDS spending by financing source, 2007 - 2021 6 Millions 5 4 3 2.47 2 1.21.3 1 0 2007 2008 2009 2010 2011 2013 2014 2016 2017 2018 2019 2020 2021 Domestic funding International funding Total AIDS spending 28 Source: Prepared by www.aidsdatahub.org based on UNAIDS HIV Financial Dashboard and NASA 2017-2021
HIV and AIDS Data Hub for Asia-Pacific HIV spending in Mongolia by AIDS Spending Category in 2017-2021 Prevention 2021 $0.45 $0.79 $0.63 $0.04 $0.57 HIV testing 2020 $0.40 $1.12 $0.51 $0.05 $0.76 $0.05 Care & Treatment Social enablers 2019 $0.31 $0.98 $0.06 $0.82 $0.19 $0.38 Programmatic enablers 2018 $0.31 $0.81 $0.47 $0.07 $0.81 $0.01 Development synergies HIV Research 2017 $0.08 $0.58 $0.81 $0.87 $0.08 $1.01 $0 $1 $2 $3 $4 Millions US$ 29 Source: Prepared by www.aidsdatahub.org based on NASA 2017-2021
HIV and AIDS Data Hub for Asia-Pacific HIV expenditure by spending category and financing source, 2021 Programmatic enablers 33% 67% Social enablers 100% Public Care and Treatment 79% 21% Private HIV testing 50.5% 13% 36.5% International Prevention 99% 0% 20% 40% 60% 80% 100% 30 Source: Prepared by www.aidsdatahub.org based on NASA 2017-2021
National response www.aidsdatahub.org
HIV and AIDS Data Hub for Asia-Pacific Proportion of female sex workers and men who have sex with men reached with HIV prevention programmes, 2005-2022 100 % 77 80 70 67 64 74 60 64 64 60 38 40 33 26 27 20 25 18 0 2005 2007 2009 2012 2014 2019 2022 Female sex workers Men who have sex with men Source: Prepared by www.aidsdatahub.org based on Second Generation Surveillance Reports 2005-2014 cited in Mongolia Global AIDS Response Progress Reporting 2015 (Country Narrative Report), Global AIDS Monitoring Reporting and IBBS 2019 and 2022 32
HIV and AIDS Data Hub for Asia-Pacific Proportion of key populations reached with HIV prevention programmes, 2022 95 52 Percent 38 25 0 Transgender Female sex workers Men who have sex with men Total <25 yr 25+ yr 33 Source: Prepared by www.aidsdatahub.org based on National Center for Communicable Diseases, Mongolia (2022). Integrated biological and behavioral survey among high-risk population in Mongolia, 2022
HIV and AIDS Data Hub for Asia-Pacific Proportion of key populations who received an HIV test in the last 12 months and know their results, 2009-2022 97 96 100 % 88 81 78 76 80 69 65 63 55 60 53 52 40 20 0 2009 2012 2014 2016 2019 2022 Men who have sex with men Female sex workers Source: Prepared by www.aidsdatahub.org based on Second Generation Surveillance Reports 2005-2014 cited in Mongolia Global AIDS Response Progress Reporting 2015 (Country Narrative Report), Global AIDS Monitoring Reporting and IBBS 2019 and 2022 34
HIV and AIDS Data Hub for Asia-Pacific Annual number of people on ART, 2005-2022 300 254 250 # peopleon ART 200 150 100 50 0 Number of health facilities that offer ART 35 Source: Prepared by www.aidsdatahub.org based on UNAIDS HIV Estimates 2023
HIV and AIDS Data Hub for Asia-Pacific ART scale-up, 2000 - 2022 300 100 254 250 80 ART coverage (%) 200 60 Number 150 40 100 20 40 50 0 - % PLHIV on ART Number of people on ART 36 Source: Prepared by www.aidsdatahub.org based on UNAIDS HIV estimates 2023
HIV and AIDS Data Hub for Asia-Pacific Treatment cascade, 2022 700 Number of people <1000 287 254 254 238 0 Estimated PLHIV PLHIV who know their HIV status People on ART Tested for viral load PLHIV who have viral suppression * * Number of people on ART who received a viral load test in the past year and have viral load of <1000 copies/ml 37 Source: Prepared by www.aidsdatahub.org based on UNAIDS HIV estimates 2023
HIV and AIDS Data Hub for Asia-Pacific HIV testing and treatment cascade, 2022 100 % 95 90 86 80 60 40 20 40 NA NA - PLHIV who know their status PLHIV on treatment PLHIV with suppressed viral load Progress (%) Gap Target 38 Source: Prepared by www.aidsdatahub.org based on UNAIDS HIV estimates 2023
HIV and AIDS Data Hub for Asia-Pacific HIV testing and treatment cascade, women (aged 15+ years) compared to men (aged 15+ years), 2022 100 % 80 60 40 47 42 20 40 39 33 31 0 People living with HIV who know their status People living with HIV who are on treatment People living with HIV who have suppressed viral load Women (aged 15 and older) living with HIV Men (aged 15 and older) living with HIV 39 Source: Prepared by www.aidsdatahub.org based on UNAIDS 2023 HIV Estimates
HIV and AIDS Data Hub for Asia-Pacific Punitive and discriminatory laws, 2022 Laws or policies restricting the entry, stay and residence of people living with HIV Law allows for possession of a certain limited amount of drugs for personal use Parental consent for adolescents to access HIV testing Criminalization of same-sex sexual acts Criminalization of TG people Criminalization of sex work NO NO YES NO YES * NO INFORMATION AVAILABLE * For adolescents <18 yr Sources: Prepared by www.aidsdatahub.org based on UNAIDS. (2023). The path that ends AIDS: UNAIDS Global AIDS Update 2023. Geneva: Joint United Nations Programme on HIV/AIDS; 2023.
HIV and AIDS Data Hub for Asia-Pacific THANK YOU slides compiled by www.aidsdatahub.org Data shown in this slide set are comprehensive to the extent they are available from country reports. Please inform us if you know of sources where more recent data can be used. Please acknowledge www.aidsdatahub.org if slides are lifted directly from this site 41


