Impacts of Thermosphere Contraction on Debris Accumulation and Orbital Capacity
Explore the effects of thermosphere contraction on debris accumulation and orbital capacity, as discussed in a workshop at Politecnico di Milano. Satellite observations reveal increasing COx levels, impacting the upper atmosphere's chemistry. The concern for space debris management is highlighted, emphasizing the challenges and benefits of the changing environment on space activities. Witness the historical Thor-Ablestar breakup event and the implications it holds for the future of space sustainability.
Download Presentation

Please find below an Image/Link to download the presentation.
The content on the website is provided AS IS for your information and personal use only. It may not be sold, licensed, or shared on other websites without obtaining consent from the author.If you encounter any issues during the download, it is possible that the publisher has removed the file from their server.
You are allowed to download the files provided on this website for personal or commercial use, subject to the condition that they are used lawfully. All files are the property of their respective owners.
The content on the website is provided AS IS for your information and personal use only. It may not be sold, licensed, or shared on other websites without obtaining consent from the author.
E N D
Presentation Transcript
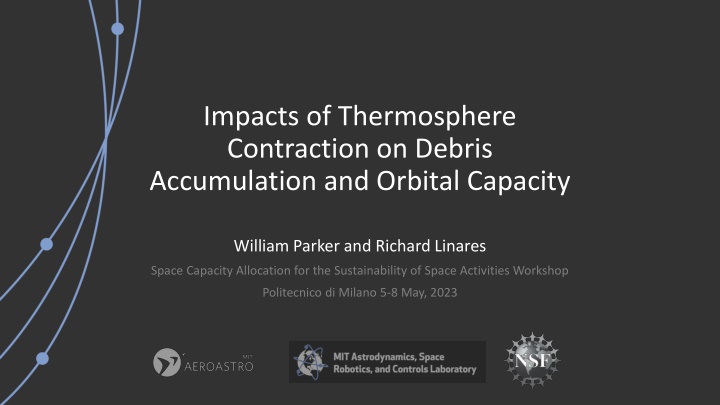
Impacts of Thermosphere Contraction on Debris Accumulation and Orbital Capacity William Parker and Richard Linares Space Capacity Allocation for the Sustainability of Space Activities Workshop Politecnico di Milano 5-8 May, 2023
Climate Change on Earths Surface NOAA Climate.gov 2
Changes in Atmospheric Chemistry Satellite observations of solar occultation spectra show an estimated global increase in COx of 23.5 +/- 6.3 ppm per decade, 10 ppm faster than predicted CO2 is the primary radiative cooling agent in the upper atmosphere Emmert, J.T., Drob, D.P., Shepherd, G.G., et al. (2018). Observations of increasing carbon dioxide concentration in Earth's thermosphere. Nature Geoscience, 11(12), 934-938. https://doi.org/10.1038/s41561-018-0243-6 4
Exosphere Thermosphere Mesosphere Stratosphere Troposphere 5
Exosphere COOLING Thermosphere Greenhouse gasses Mesosphere Stratosphere Troposphere WARMING 6
Exosphere COOLING CONTRACTION Thermosphere Greenhouse gasses Mesosphere Stratosphere Troposphere WARMING 7
Why do we care? Drag force cleans out LEO Pro: easier to keep operational satellites in orbit Con: harder to get rid of derelict satellites and debris 9
Falling Debris in a Dynamic Atmosphere Altitude [km] Year 10
Orbital Populations as a Source-Sink System Shell i + 1 Collisions within shell create debris Shell i Shell i - 1 Propulsive post- mission disposal (PMD) New launches of active satellites Drag removes debris from shell Drag pulls transient objects through shell 13
Satellites Derelicts Debris Satellites (Steady State) Derelicts (Steady State) Debris (Steady State) Sustainable Capacity Unstable Populations, Exceeding Capacity Unstable Populations, Exceeding Capacity Stable Populations at Capacity Stable Populations at Capacity Number of Objects Number of Objects 14
Computing sustainable capacity 1. Start at top shell: No flux from above, so Maximize ??such that ?? ? < ???over simulation window ? = 5 ? = 4 ? = 3 ? = 2 ? = 1 15
Computing sustainable capacity 1. Start at top shell: No flux from above, so Maximize ??such that ?? ? < ???over simulation window ? = 5 ? = 4 2. Move down one shell with known debris flux from above based on ??, compute ?? 1 under these conditions ? = 3 ? = 2 ? = 1 16
Computing sustainable capacity 1. Start at top shell: No flux from above, so Maximize ??such that ?? ? < ???over simulation window ? = 5 ? = 4 2. Move down one shell with known debris flux from above based on ??, compute ?? 1 under these conditions ? = 3 ? = 2 ? = 1 17
Computing sustainable capacity 1. Start at top shell: No flux from above, so Maximize ??such that ?? ? < ???over simulation window ? = 5 ? = 4 2. Move down one shell with known debris flux from above based on ??, compute ?? 1 under these conditions 3. Continue until the bottom shell ? = 3 . . . ? = 2 ? = 1 18
Capacity distributions across shells 36% reduction in capacity at 400-600 km! 19
Takeaways Climate change has real impact on Earth s upper atmosphere -5-7%/decade @ 400 km Sustainable capacity is very sensitive to reductions in atmospheric density Neglecting thermosphere contraction in long-term debris evolutionary models may provide poor insights 20
Thank you! wparker@mit.edu
Computing sustainable capacity Assumptions: No initial debris population 10 year satellite lifetime Perfect post-mission disposal, immediate replacement 1. 2. 3. Satellite collision avoidance active (99% effective) No debris flux from above 900 km Simplified breakup model: uniform characteristic debris, derelict, and satellites 4. 5. 6. Circular orbits (no population interactions between shells except for decay) 7. 23
S = Active satellite D = Derelict Satellite N = Debris Source-Sink Dynamics new launches Derelict collisions Derelict Flux Active satellite collisions post-mission disposal (Some satellites fail on disposal) All collisions generate debris Debris Flux 24
Projected Atmospheric Contraction Contraction is happening more rapidly at higher altitudes 25
LEO is getting crowded Chinese ASAT test, 2008 Cosmos-Iridium Collision, 2009 Starlink 26
Ongoing and Future Work How much capacity can we gain back through technological intervention (collision avoidance maneuvering, ADR, improved observation, etc.)? How much capacity is lost by irresponsible action like anti-satellite weapons tests? Does thermosphere contraction make the influence of space weather less important for conjunction assessment? 29
