Impact of Cohort Size and Structure on Academic Pathways
This presentation explores how cohort size and structure influence academic pathways in schools. It delves into the effects of student numbers and master schedule structures on cohort courses, using examples and visuals to illustrate the concepts. From analyzing a Linked Learning Pathway with 120 students to expanding it to 150 students, the presentation highlights key aspects such as common prep periods, teacher schedules, student groupings, and course distribution. The intricate dynamics of these elements demonstrate the importance of effective cohort management for maintaining course integrity and enhancing student learning experiences.

Download Presentation

Please find below an Image/Link to download the presentation.
The content on the website is provided AS IS for your information and personal use only. It may not be sold, licensed, or shared on other websites without obtaining consent from the author.If you encounter any issues during the download, it is possible that the publisher has removed the file from their server.
You are allowed to download the files provided on this website for personal or commercial use, subject to the condition that they are used lawfully. All files are the property of their respective owners.
The content on the website is provided AS IS for your information and personal use only. It may not be sold, licensed, or shared on other websites without obtaining consent from the author.
E N D
Presentation Transcript
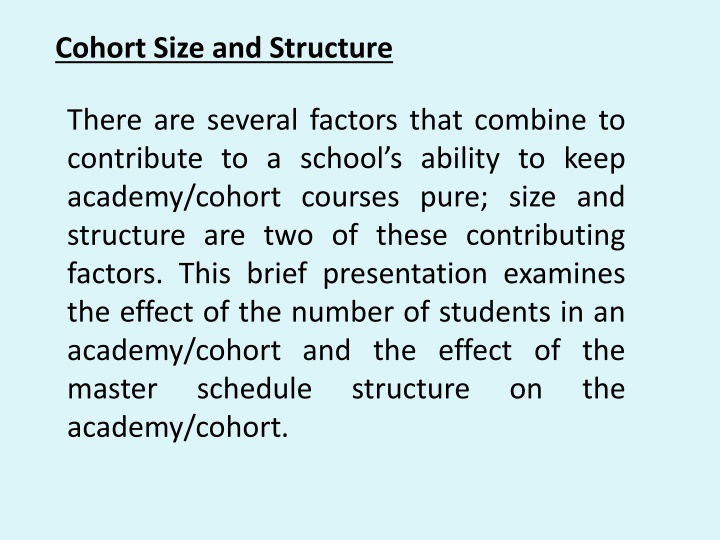
Cohort Size and Structure There are several factors that combine to contribute to a school s ability to keep academy/cohort courses pure; size and structure are two of these contributing factors. This brief presentation examines the effect of the number of students in an academy/cohort and the effect of the master schedule academy/cohort. structure on the
Lets look at a Linked Learning Pathway/Cohort with the following: A 6 period student day Teachers that teach 5 periods per day Pathway Teachers have a common planning period A pathway with 4 teachers The cohort is composed of 120 students organized in 4 groups of 30 students each, Group A, B, C and D Each group of students takes the same 4 courses in the Linked Learning pathway, Course 1, 2, 3 and 4
Pathway with 120 students (Each Letter Represents a Group of 30 Students in this Pathway) Aspects of this structure: Common prep Teachers teach one period out of the academy Students take 4 classes in academy and 2 out Students in academy can go out for classes during period 1 & 6 Academy field trips complicated by 6th period outside class (students in academy periods 3- 6 improves the ability to take field trips) Per 1 Per 2 Per 3 Per 4 Per 5 Per 6 Course 1 PREP A B C D Course 2 PREP B C D A Course 3 PREP C D A B Course 4 PREP D A B C A A B B C C D D Now let s see what happens with 30 more students
Pathway with 150 students (Each Letter Represents a Group of 30 Students in this Pathway) Aspects of this structure: Common prep Teachers teach all 5 periods in the academy Students take 4 classes in academy and 2 out Students in academy can go out for classes during any period 1 6 (a student can change group to go out any period) Academy field trips complicated by students taking classes outside of the academy during all periods of the day Per 1 Per 2 Per 3 Per 4 Per 5 Per 6 Course 1 PREP A B C D E Course 2 PREP Course 3 PREP B C C D D E E A A B Course 4 PREP D E A B C A A B B C C D D E E
Grade Level Pathway with 150 Students Period 1 2 3 4 5 6 Group A English 10 Group B English 10 Group C English 10 Group D English 10 Group E English 10 English Teacher Common Planning Group B World Hist 10 Group C World Hist 10 Group D World Hist 10 Group E World Hist 10 Group A World Hist 10 History Teacher Common Planning Group C Chemistry 10 Group D Chemistry 10 Group E Chemistry 10 Group A Chemistry 10 Group B Chemistry 10 Science Teacher Common Planning Group D Prin Bio Med Sci 10 Group E Prin Bio Med Sci 10 Group A Prin Bio Med Sci 10 Group B Prin Bio Med Sci 10 Group C Prin Bio Med Sci 10 Tech Teacher Common Planning Groups able to go out of the cohort for classes ALL E A B C D
The 300 Student Model The 300 student model on the next page has the following attributes: 8 teachers all with common prep Teachers teach all 5 periods in the academy Each teacher teaches 150 of the 300 students internal rotation of classes will allow all teachers to work with all students Students take 4 classes in academy and 2 out Students in academy can go out for classes during any period 1 6 (a student can change group to go out any period) Academy field trips complicated by students taking classes outside of the academy during all periods of the day Now we will take a look at this model and follow a band student in group A who also takes Algebra 2
Pathway with 300 students (Each Letter Represents a Group of 30 Students in this Pathway) Per 1 Per 2 Per 3 Per 4 Per 5 Per 6 English Prep A B C D E English Prep F G H I J History Prep B C D E F History Prep G H I J A Science Prep C H D I E J F A G B Science Prep Tech Prep D E F G H Tech Prep I J A B C All Out E & J A & F B & G C & H D & I Band Alg 1 Alg 2 Geom Chem Physics Alg 2 AP AP AP Course World Language Course World Language Course World Language
Pathway with 300 students Period 1 2 3 4 5 6 Common Planning Group A English 10 Group B English 10 Group G English 11 Group C World Hist 10 Group H Gov/Econ 12 Group D Chemistry 10 Group I Anat & Physiology 12 Group E Med Interventions 11 Group J Med Research 12 Group C English 10 Group H English 12 Group D World Hist 10 Group I Gov/Econ 12 Group E Physics 11 Group J Anat & Physiology 12 Group F Med Interventions 11 Group A Prin Bio Med Sci 10 Group D English 10 Group I English 12 Group E US Hist 11 Group J Gov/Econ 12 Group F Physics 11 Group E English 11 Group J English 12 Group A World Hist 10 Group F US Hist 11 Group G Physics 11 Group B Chemistry 10 Group C Prin Bio Med Sci 10 Group H Med Research 12 English Teacher 1 Common Planning Common Planning Common Planning Common Planning Common Planning Common Planning Common Planning Group F English 11 Group B World Hist 10 Group G US Hist 11 Group C Chemistry 10 Group H Anat & Physiology 12 Group D Prin Bio Med Sci 10 Group I Med Research 12 English Teacher 2 History Teacher 1 History Teacher 2 Science Teacher 1 Group A Chemistry 10 Group G Med Interventions 11 Group B Prin Bio Med Sci 10 Science Teacher 2 Tech Teacher 1 Tech Teacher 2 Groups able to go out of the cohort for classes ALL E & J A & F B & G C & H D & I
The Golden Numbers How do you know the best configuration of a Linked Learning Cohort? Number of teachers Number of periods Number of students Tool: Cohort Size Calculator Excel Spreadsheet Case Load Maximum Number of Student Periods Number of Faculty Periods Number of Faculty on Team Number of Periods on Team 150 6 5 4 5 Fill in the 5 values and a chart on the spreadsheet will show you workable configurations