Image Processing

 undefined

I
m
a
g
e
P
r
o
c
e
s
s
i
n
g
ا
ل
م
ر
ح
ل
ة
ا
ل
ر
ا
ب
ع
ة
SECOND lecture
by
Assit.Lec. Shaimaa Shukri


Chapter
One
Introduction
to
Computer Vision
and Image Processing
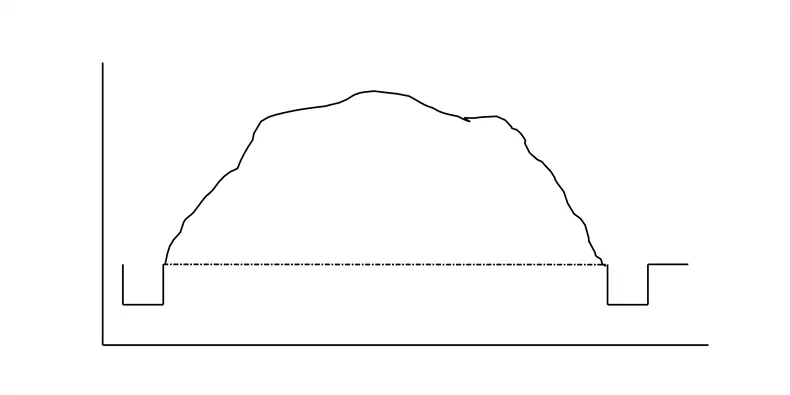
below
we
see
one
line
of
a
video
signal
being
sampled
(digitized)
by
instantaneously measuring the voltage
of
the
signal
at
fixed intervals
in
time.
The
value
of
the
voltage
at
each
instant
is
converted
into
a
number
that
is
stored, corresponding to the brightness
of
the image
at
that point.
Note that
the
image brightness
of the
image
at
that point
depends on both
the
intrinsic properties
of
the object
and
the lighting conditions in the
scene.

Figure
(1.5) Digitizing (Sampling
) an
Analog
Video
Signal[1].
The image
can
now
be
accessed
as a
two-dimension
array of
data
,
where each data point is
referred
to
a
pixel (picture element).for digital
images we will use the following notation
:
One
li
ne
of
infor
m
a
t
ion


v
o
l
t
a
g
e

Time
Digitizing
(sampling)
an
analog
video
signal
One
pi
x
e
l

7
Chapter
One
Introduction
to
Computer Vision
and Image Processing
I(r,c) =
The brightness
of
image
at
the point
(r,c)
Where
r= row
and
c=
column.
“When we
have
the data in digital
form,
we
can
use the software to process
the
data”.
The digital image
is 2D- array
as:
I(
0
,
0
)
I(
1
,
0
)
I(0,1)
………………………..I(0,N-1)
I(1,1)
………………………..I(1,N-1)
……………………………………………………
…………………………………………………….
I(N-1,0)
I(N-1,1)
…….……………..I(N-1,N-1)
In
above image matrix, the image size is
(NXN)
[matrix dimension] then:
Ng=
2
m
………..(1)
Where Ng denotes the number
of gray
levels
m,
where
m is
the
no. of
bits
contains
in
digital image
matrix.
Example
:
If
we
have
(6
bit)
in
128
X
128
image
.Find
the
no.
of
gray
levels
to
represent it ,then find the no.
of
bit in
this
image?
Solution
:
N
g
=
2
6
=64
Gray
Level
N
b
=
128
*
128*
6=
9.8304
* 10
4
bit
6.
The
Human
Visual
System
The Human Visual System (HVS)
has two primary
components:
Eye.
Brian.
*
The structure that we know the most about is the image receiving sensors
(the human
eye).
8
Chapter
One
9
Introduction
to
Computer Vision
and Image Processing
*
The brain can be thought
as
being
an
information processing unit
analogous to the computer
in
our computer imaging
system.
These
two
are
connected
by
the
optic
nerve,
which
is
really
a
bundle
of
nerves that contains the path
ways
for
visual information to travel from
the
receiving sensor (the eye)
to the
processor (the
brain).
1.7
Image
Resolution
Pixels are
the
building blocks
of
every digital image. Clearly
defined
squares
of
light and color data
are
stacked
up
(ةسدكم
)
next
to
one
another both horizontally
and vertically
.
Each
picture element (pixel
for
short)
has
a
dark
to
light value
from 0
(solid
black)
to 255
(pure
white).
That
is,
there are 256 defined values.
A
gradient
(رادحنلاا
ةبسن
,ليم)
is
the gradual
transition from
one
value
to
another in sequence. At the heart
of
any
convincing photographic rendering
is a
smooth, seamless
(
سلس)
and beautiful
gradation.
In
computers, resolution is the number
of
pixel
s (individual points of
color)
contained
on
a
display
monitor,
expressed
in
terms
of
the
number
of
pixels on the horizontal axis
and
the
number on the vertical axis. The
sharpness
of
the image on
a display
depends on
the
resolution
and
the size
of
the
monitor. The same pixel resolution
will
be
sharper on
a
smaller monitor
and gradually
lose
sharpness on larger monitors because the
same
numbers
of
pixels
are
being spread out over
a
larger number
of
inches
.
Display resolution
is
not measured in dots
per
inch
as
it usually
is
with
printers
(We measure resolution
in
pixels
per
inch or
more
commonly,
dots
per inch
(dpi)).
Chapter
One
Introduction
to
Computer Vision
and Image Processing
A
display with 240 pixel
columns
and 320 pixel rows
would
generally
be
said to
have a
resolution
of
240x320.
Resolution can also be used to refer
to
the total number
of
pixels in
a
digital camera
image. For
example,
a
camera that can create images of
1600x1200 pixels will sometimes
be referred to
as
a 2
megapixel
resolution camera
since
1600
x
1200
=
1,920,000 pixels,
or
roughly
2
million
pixels.
Below
is
an
illustration
of
how the
same
image
might
appear
at
different pixel resolutions,
if
the pixels were poorly
rendered
as
sharp
squares (normally,
a
smooth image reconstruction from pixels would
be preferred,
but for illustration
of
pixels,
the
sharp squares make the
point
better).
Figure
(1.6)
:
Image Resolution
.
An image that
is
2048 pixels
in
width
and
1536 pixels in height has
a
total
of
2048×1536
=
3,145,728 pixels
or 3.1
megapixels. One could
refer
to it
as
2048
by
1536
or a 3.1-megapixel
image.
1.8
Image
brightness
Adaption
Brightness is intensity
of
light
in
simple words. Adaptation basically
is
"getting used to" and
be
comfortable with it.
So
conceptually brightness
adaption
is
basically "getting used
to
changes
in
brightness/
changes
10
Chapter
One
11
Introduction
to
Computer Vision
and Image Processing
intensity
of
light".
A
simple example
is
when you
go
out
into
light
from
darkness you take
some
time
to "get used" to the
brightness outside and feel
comfortable.
This
is what exactly
is
brightness
adaption.
In
image we observe many brightness levels
and
the vision system
can
adapt
to a
wide range.
If
the
mean value
of
the pixels inside the image is around
Zero
gray
level then
the
brightness is low and
the
images dark but
for
mean
value near the 255 then the image
is
light.
If fewer
gray levels
are
used,
we
observe false contours
(
ينحنم
)
bogus lines resulting from gradually changing
light intensity
not
being accurately
represented.
9.
Image
Representation
We
have
seen that the human visual system
(HVS) receives an
input
image
as a
collection
of
spatially distributed light energy; this is form
is
called
an
optical image. Optical images are
the
type we
deal
with every
day
–cameras captures
them,
monitors display them,
and
we see
them
[we
know that these optical images are represented
as
video information in the
form
of
analog
electrical
signals
and
have
seen
how
these
are
sampled
to
generate the digital image
I(r ,
c).
The digital image
I
(r,
c)
is represented
as
a two-
dimensional array
of
data,
where each pixel value corresponds
to
the brightness
of
the image
at
the
point
(r, c).
in
linear
algebra terms
, a
two-dimensional array
like
our
image model
I( r, c ) is
referred to
as a
matrix
,
and
one
row
( or
column)
is
called
a
vector. The image types we will consider
are:
1.
Binary Image
Binary images are
the simplest type
of images
and can take
on
two
values, typically
black
and
white, or
‘0’
and
‘1’.
A binary
image is
Chapter
One
Introduction
to
Computer Vision
and Image Processing
referred
to
as a 1
bit/pixel image because
it
takes only
1
binary digit to
represent
each
pixel.
These
types
of
images
are
most frequently
in
computer vision
application
where
the
only information required for
the
task is general shapes,
or
outlines information.
For
example,
to
position
a
robotics gripper to grasp
(
كسمي
)
an
object
or in
optical character recognition
(OCR).
Binary images are
often created from
gray-scale
images via
a
threshold
value
is,
those values
above it
are turned white (‘1’),
and
those below it
are
turned black (‘0’).
Figure
(1.7)
Binary Images.
2.
Gray Scale
Image
Gray
_scale
images
are
referred
to as
monochrome,
or one-color
image. They
contain
brightness information only
, no
color information.
The number
of
different brightness level available. The typical image
contains
8
bit/ pixel
(data,
which allows
us to
have
(0-255)
different
brightness (gray)
levels.
The
8
bit representation
is typically
due to the
fact
that
the
byte,
which
corresponds
to
8-bit
of
data,
is
the standard
small unit in the
world
of
digital
computer.
12
Chapter
One
Introduction
to
Computer Vision
and Image Processing
Figure
(1.8):
Gray
Scale
Images.
3.
Color
Image
Color image
can be
modeled
as
three band monochrome
image
data,
where each band
of
the data corresponds to
a
different
color.
Figure
(1.9) :
Color
Images.
The
actual
information
stored
in
the
digital
image
data
is
brightness
information in each spectral band. When the image
is
displayed,
the
corresponding brightness information is displayed on the
screen by
picture elements that emit light
energy
corresponding to that particular
color.
Typical color images
are
represented
as
red, green
,
and blue
or
RGB
i
m
a
g
es
.us
i
ng
t
h
e
8
-
bi
t
m
ono
c
hr
o
m
e
st
a
n
da
r
d
as
a
m
o
d
el
,
t
he
13
Chapter
One
Introduction
to
Computer Vision
and Image Processing
corresponding color image would have 24 bit/pixel
– 8
bit for each color
bands (red, green and
blue ).
The following
figure
we
see a
representation
of a
typical RGB color
image.
I
R
(r,c)
I
G
(r,c)
I
B
(r,c)
Figure (1.10)
:A
color pixel vector consists
of
the red, green
and
blue pixel
values
(R,
G,
B) at
one given
row/column
pixel coordinate(
r ,
c)
[1].
Figure
(1.9)
:
Typical RGB
color
image can
be
thought
as
three separate
images I
R
(r,c),I
G
(r,c),I
B
(r,c)
[1]
The following figure illustrate that in addition to referring to arrow
or
column
as a
vector, we
can
refer to
a
single pixel
red
,green, and blue
values
as
a
color
pixel
vector –(R,G,B
).
Blue
Green
Red
14
Chapter
One
Introduction
to
Computer Vision
and Image Processing
Figure
(1.11)
:A
color pixel vector consists
of
the red, green
and
blue
.
For
many applications, RGB color information
is
transformed into
mathematical space that that decouples the brightness information from the
color
information.
The hue/saturation /lightness (HSL) color transform allows
us to
describe
colors in
terms
that
we
can
more
readily
understand.
The lightness is the brightness
of
the color, and the hue
is
what we
normally think
of
as
“color”
and the hue (ex:
green, blue,
red, and
orange).
The saturation is
a
measure
of how
much white is
in
the color
(ex:
Pink is
red
with
more
white,
so it is
less saturated than
a
pure
red).
[Most people relate to this method for describing
color}.
Example:
“a
deep,
bright orange”
would
have
a
large intensity (“bright”),
a
hue
of
“orange”,
and
a
high
value
of
saturation
(“deep”).we
can
picture
this
color
in our minds,
but if
we defined this color in
terms
of
its RGB
components, R=245, G=110 and B=20.
Modeling
the
color information creates
a
more people oriented way
of
describing the
colors.
15
Explore the fundamentals of computer vision and image processing, where images are converted into digital data for manipulation and analysis. Learn about digitizing analog video signals, representing digital images as 2D arrays, image resolution, and the human visual system. Delve into topics such as image brightness, pixel grids, gray levels, and the role of the human eye and brain in processing visual information.

Download Presentation

Please find below an Image/Link to download the presentation.
The content on the website is provided AS IS for your information and personal use only. It may not be sold, licensed, or shared on other websites without obtaining consent from the author.If you encounter any issues during the download, it is possible that the publisher has removed the file from their server.
You are allowed to download the files provided on this website for personal or commercial use, subject to the condition that they are used lawfully. All files are the property of their respective owners.
The content on the website is provided AS IS for your information and personal use only. It may not be sold, licensed, or shared on other websites without obtaining consent from the author.
E N D
Presentation Transcript
Image Processing SECOND lecture by Assit.Lec. Shaimaa Shukri
Chapter One Introduction to Computer Vision and Image Processing below we see one line of a video signal being sampled (digitized) by instantaneously measuring the voltage of the signal at fixed intervals in time. The value of the voltage at each instant is converted into a number that is stored, corresponding to the brightness of the image at that point. Note that the image brightness of the image at that point depends on both the intrinsic properties of the object and the lighting conditions in the scene. v o l t a g e Oneline ofinformation Time Digitizing (sampling) an analog videosignal One pixel Figure (1.5) Digitizing (Sampling ) an Analog Video Signal[1]. The image can now be accessed as a two-dimension array of data , where each data point is referred to a pixel (picture element).for digital images we will use the following notation : 7
Chapter One Introduction to Computer Vision and Image Processing I(r,c) = The brightness of image at the point (r,c) Where r= row and c= column. When we have the data in digital form, we can use the software to process the data . The digital image is 2D- array as: I(0,0) I(0,1) ..I(0,N-1) I(1,0) I(1,1) ..I(1,N-1) . I(N-1,0) I(N-1,1) . ..I(N-1,N-1) In above image matrix, the image size is (NXN) [matrix dimension] then: Ng= 2 m ..(1) Where Ng denotes the number of gray levels m, where m is the no. of bits contains in digital image matrix. Example :If we have (6 bit) in 128 X 128 image .Find the no. of gray levels to represent it ,then find the no. of bit in this image? Solution: Ng= 26=64 Gray Level Nb= 128 * 128* 6= 9.8304 * 104bit 6. The Human Visual System The Human Visual System (HVS) has two primary components: Eye. Brian. * The structure that we know the most about is the image receiving sensors (the human eye). 8
Chapter One Introduction to Computer Vision and Image Processing * The brain can be thought as being an information processing unit analogous to the computer in our computer imaging system. These two are connected by the optic nerve, which is really a bundle of nerves that contains the path ways for visual information to travel from the receiving sensor (the eye) to the processor (the brain). 1.7 Image Resolution Pixels are the building blocks of every digital image. Clearly defined squares of light and color data are stacked up ( ) next to one another both horizontally and vertically. Each picture element (pixel for short) has a dark to light value from 0 (solid black) to 255 (pure white). That is, there are 256 defined values. A gradient ( , ) is the gradual transition from one value to another in sequence. At the heart of any convincing photographic rendering is a smooth, seamless ( ) and beautiful gradation. In computers, resolution is the number of pixels (individual points of color) contained on a display monitor, expressed in terms of the number of pixels on the horizontal axis and the number on the vertical axis. The sharpness of the image on a display depends on the resolution and the size of the monitor. The same pixel resolution will be sharper on a smaller monitor and gradually lose sharpness on larger monitors because the same numbers of pixels are being spread out over a larger number of inches. Display resolution is not measured in dots per inch as it usually is with printers (We measure resolution in pixels per inch or more commonly, dots per inch (dpi)). 9
Chapter One Introduction to Computer Vision and Image Processing A display with 240 pixel columns and 320 pixel rows would generally be said to have a resolution of 240x320. Resolution can also be used to refer to the total number of pixels in a digital camera image. For example, a camera that can create images of 1600x1200 pixels will sometimes be referred to as a 2 megapixel resolution camera since 1600 x 1200 = 1,920,000 pixels, or roughly 2 million pixels. Below is an illustration of how the same image might appear at different pixel resolutions, if the pixels were poorly rendered as sharp squares (normally, a smooth image reconstruction from pixels would be preferred, but for illustration of pixels, the sharp squares make the point better). Figure (1.6) : Image Resolution . An image that is 2048 pixels in width and 1536 pixels in height has a total of 2048 1536 = 3,145,728 pixels or 3.1 megapixels. One could refer to it as 2048 by 1536 or a 3.1-megapixel image. 1.8 Image brightnessAdaption Brightness is intensity of light in simple words. Adaptation basically is "getting used to" and be comfortable with it. So conceptually brightness adaption is basically "getting used to changes in brightness/ changes 10
Chapter One Introduction to Computer Vision and Image Processing intensity of light". A simple example is when you go out into light from darkness you take some time to "get used" to the brightness outside and feel comfortable.This is what exactly is brightness adaption. In image we observe many brightness levels and the vision system can adapt to a wide range. If the mean value of the pixels inside the image is around Zero gray level then the brightness is low and the images dark but for mean value near the 255 then the image is light. If fewer gray levels are used, we observe false contours ( ) bogus lines resulting from gradually changing light intensity not being accurately represented. 9. Image Representation We have seen that the human visual system (HVS) receives an input image as a collection of spatially distributed light energy; this is form is called an optical image. Optical images are the type we deal with every day cameras captures them, monitors display them, and we see them [we know that these optical images are represented as video information in the form of analog electrical signals and have seen how these are sampled to generate the digital image I(r , c). The digital image I (r, c) is represented as a two- dimensional array of data, where each pixel value corresponds to the brightness of the image at the point (r, c). in linear image model I( r, c ) is referred to as a matrix , and one row ( or column) is algebra terms , a two-dimensional array likeour called a vector. The image types we will consider are: 1. Binary Image Binary images are the simplest type of images and can take on two values, typically black and white, or 0 and 1 . A binary image is 11
Chapter One Introduction to Computer Vision and Image Processing referred to as a 1 bit/pixel image because it takes only 1 binary digit to represent each pixel. These types of images are most frequently in computer vision application where the only information required for the task is general shapes, or outlines information. For example, to position a robotics gripper to grasp ( )an object or in optical character recognition(OCR). Binary images are often created from gray-scale images via a threshold value is, those values above it are turned white ( 1 ), and those below it are turned black ( 0 ). Figure (1.7) Binary Images. 2. Gray ScaleImage Gray _scale images are referred to as monochrome, or one-color image. They contain brightness information only , no color information. The number of different brightness level available. The typical image contains 8 bit/ pixel (data, which allows us to have (0-255) different brightness (gray) levels. The 8 bit representation is typically due to the fact that the byte, which corresponds to 8-bit of data, is the standard small unit in the world of digital computer. 12
Chapter One Introduction to Computer Vision and Image Processing Figure (1.8): Gray Scale Images. 3. ColorImage Color image can be modeled as three band monochrome image data, where each band of the data corresponds to a different color. Figure (1.9) : Color Images. The actual information stored in the digital image data is brightness information in each spectral band. When the image is displayed, the corresponding brightness information is displayed on the screen by picture elements that emit light energy corresponding to that particular color. Typical color images are represented as red, green , and blue or RGB images .using the 8-bit monochrome standard as a model , the 13
Chapter One Introduction to Computer Vision and Image Processing corresponding color image would have 24 bit/pixel 8 bit for each color bands (red, green and blue ). The following figure we see a representation of a typical RGB color image. IR(r,c) IG(r,c) IB(r,c) Figure (1.9) :Typical RGB color image can be thought as three separate images IR(r,c),IG(r,c),IB(r,c) [1] The following figure illustrate that in addition to referring to arrow or column as a vector, we can refer to a single pixel red ,green, and blue values as a color pixel vector (R,G,B ). Blue Green Red Figure (1.10) :A color pixel vector consists of the red, green and blue pixel values (R, G, B) at one given row/column pixel coordinate( r , c) [1]. 14
Chapter One Introduction to Computer Vision and Image Processing Figure (1.11) :A color pixel vector consists of the red, green and blue . For many applications, RGB color information is transformed into mathematical space that that decouples the brightness information from the color information. The hue/saturation /lightness (HSL) color transform allows us to describe colors in terms that we can more readily understand. The lightness is the brightness of the color, and the hue is what we normally think of as color and the hue (ex: green, blue, red, and orange). The saturation is a measure of how much white is in the color (ex: Pink is red with more white, so it is less saturated than a pure red). [Most people relate to this method for describing color}. Example: a deep, bright orange would have a large intensity ( bright ), a hue of orange , and a high value of saturation ( deep ).we can picture this color in our minds, but if we defined this color in terms of its RGB components, R=245, G=110 and B=20. Modeling the color information creates a more people oriented way of describing the colors. 15