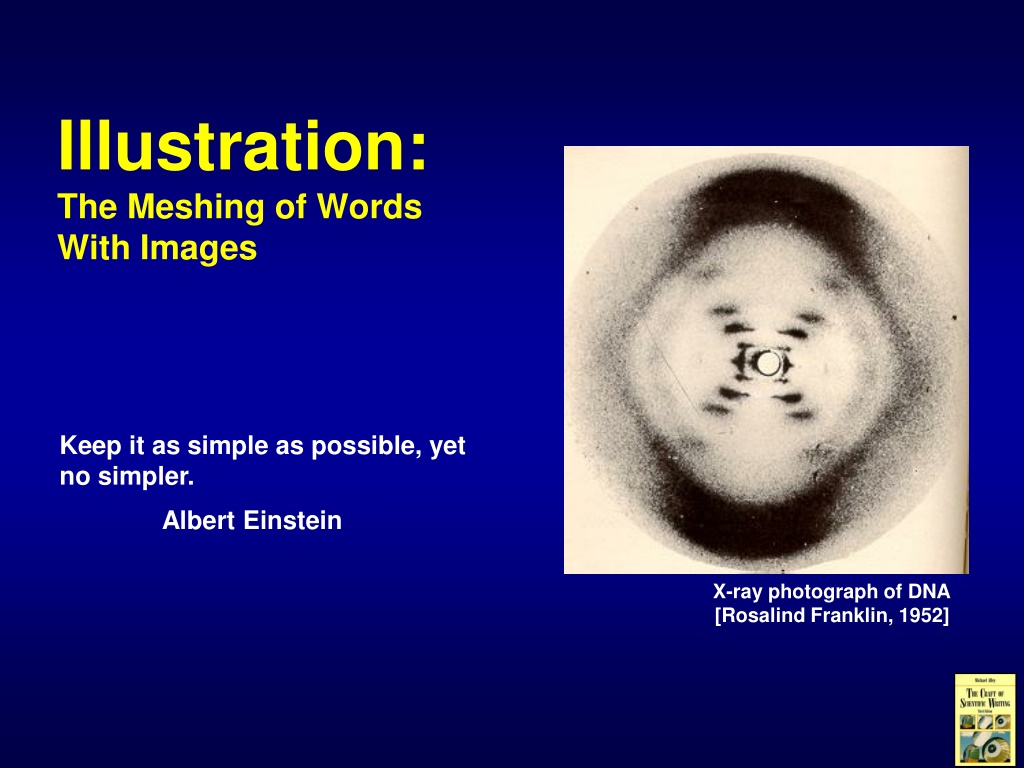
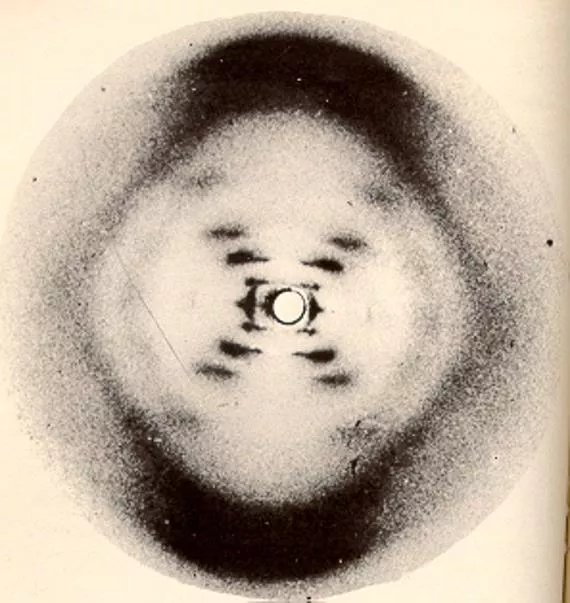
Illustration: The Meshing of Words With Images

K
e
e
p
i
t
a
s
s
i
m
p
l
e
a
s
p
o
s
s
i
b
l
e
,
y
e
t
n
o
s
i
m
p
l
e
r
.
A
l
b
e
r
t
E
i
n
s
t
e
i
n
I
l
l
u
s
t
r
a
t
i
o
n
:
T
h
e
M
e
s
h
i
n
g
o
f
W
o
r
d
s
W
i
t
h
I
m
a
g
e
s
X
-
r
a
y
p
h
o
t
o
g
r
a
p
h
o
f
D
N
A
[
R
o
s
a
l
i
n
d
F
r
a
n
k
l
i
n
,
1
9
5
2
]


T
a
b
l
e
1
.
R
e
a
c
t
o
r
p
o
w
e
r
l
e
v
e
l
s
i
n
C
h
e
r
n
o
b
y
l
a
c
c
i
d
e
n
t
[
W
o
l
f
s
o
n
,
1
9
9
1
]
.

T
w
o
t
y
p
e
s
o
f
i
l
l
u
s
t
r
a
t
i
o
n
s
e
x
i
s
t
:
t
a
b
l
e
s
a
n
d
f
i
g
u
r
e
s
T
a
b
l
e
2
.
S
e
q
u
e
n
c
e
o
f
e
v
e
n
t
s
i
n
t
h
e
C
h
e
r
n
o
b
y
l
a
c
c
i
d
e
n
t
[
W
o
l
f
s
o
n
,
1
9
9
1
]
.
A
p
r
i
l
2
5
A
p
r
i
l
2
5
A
p
r
i
l
2
5
A
p
r
i
l
2
6
A
p
r
i
l
2
6
A
p
r
i
l
2
6
D
a
t
e
T
i
m
e
P
o
w
e
r
L
e
v
e
l
E
v
e
n
t
1
:
0
0
a
.
m
.
2
:
0
0
p
.
m
.
1
1
:
1
0
p
.
m
.
1
:
0
0
a
.
m
.
1
:
1
9
a
.
m
.
1
:
2
3
a
.
m
.
3
2
0
0
M
W
1
6
0
0
M
W
1
6
0
0
M
W
3
0
M
W
2
0
0
M
W
2
,
0
0
0
,
0
0
0
M
W
O
p
e
r
a
t
o
r
s
b
e
g
i
n
p
o
w
e
r
d
e
s
c
e
n
t
P
o
w
e
r
d
e
s
c
e
n
t
d
e
l
a
y
e
d
f
o
r
9
h
o
u
r
s
E
m
e
r
g
e
n
c
y
c
o
r
e
-
c
o
o
l
i
n
g
s
y
s
t
e
m
d
i
s
c
o
n
n
e
c
t
e
d
O
p
e
r
a
t
o
r
s
s
w
i
t
c
h
o
f
f
a
u
t
o
m
a
t
i
c
c
o
n
t
r
o
l
P
o
w
e
r
d
e
s
c
e
n
t
r
e
s
u
m
e
d
P
o
w
e
r
m
i
n
i
m
u
m
r
e
a
c
h
e
d
O
p
e
r
a
t
o
r
s
p
u
l
l
r
o
d
s
b
e
y
o
n
d
a
l
l
o
w
a
b
l
e
l
i
m
i
t
s
O
p
e
r
a
t
o
r
s
s
t
a
r
t
t
w
o
a
d
d
i
t
i
o
n
a
l
c
o
o
l
a
n
t
p
u
m
p
s
O
p
e
r
a
t
o
r
s
v
i
o
l
a
t
e
c
o
o
l
a
n
t
f
l
o
w
l
i
m
i
t
s
P
o
w
e
r
s
u
r
g
e
s
b
y
f
a
c
t
o
r
o
f
1
0
,
0
0
0
i
n
5
s
e
c
o
n
d
s
T
a
b
l
e
s
c
a
n
p
r
e
s
e
n
t
w
o
r
d
s
a
s
w
e
l
l
a
s
n
u
m
b
e
r
s
W
h
e
n
p
r
e
s
e
n
t
i
n
g
n
u
m
e
r
i
c
a
l
d
a
t
a
,
y
o
u
c
h
o
o
s
e
b
e
t
w
e
e
n
t
a
b
l
e
s
a
n
d
g
r
a
p
h
s
T
e
m
p
e
r
a
t
u
r
e
(
K
)
D
i
s
t
a
n
c
e
F
r
o
m
B
u
r
n
e
r
(
m
m
)
F
i
g
u
r
e
3
.
C
o
m
p
u
t
a
t
i
o
n
a
l
a
n
d
e
x
p
e
r
i
m
e
n
t
a
l
t
e
m
p
e
r
a
t
u
r
e
s
f
o
r
l
a
m
i
n
a
r
d
i
f
f
u
s
i
o
n
f
l
a
m
e
s
[
S
a
n
d
i
a
,
1
9
8
7
]
.
L
i
n
e
g
r
a
p
h
s
a
r
e
c
o
m
m
o
n
i
n
e
n
g
i
n
e
e
r
i
n
g
a
n
d
s
c
i
e
n
c
e
F
i
g
u
r
e
4
.
R
e
s
p
o
n
s
e
o
f
T
-
c
e
l
l
s
i
n
c
o
s
m
o
n
a
u
t
s
a
f
t
e
r
s
h
o
r
t
-
t
e
r
m
a
n
d
l
o
n
g
-
t
e
r
m
f
l
i
g
h
t
s
[
K
o
n
s
t
a
n
t
i
n
o
v
a
,
1
9
9
1
]
.
C
e
l
l
s
%
F
l
i
g
h
t
D
u
r
a
t
i
o
n
(
D
a
y
s
)
1
0
2
0
3
0
7
-
1
0
1
1
2
–
1
7
5
2
1
1
–
3
6
6
N
o
r
m
a
l
r
a
n
g
e
B
a
r
g
r
a
p
h
s
c
o
m
p
a
r
e
w
h
o
l
e
s
G
a
n
t
t
c
h
a
r
t
s
a
r
e
a
t
y
p
e
o
f
b
a
r
c
h
a
r
t
s
I
n
d
u
s
t
r
i
a
l
w
a
s
t
e
s
(
2
8
%
)
M
e
d
i
c
a
l
a
n
d
r
e
s
e
a
r
c
h
w
a
s
t
e
s
(
1
6
%
)
P
o
w
e
r
r
e
a
c
t
o
r
w
a
s
t
e
s
(
6
4
%
)
P
o
w
e
r
R
e
a
c
t
o
r
I
n
d
u
s
t
r
i
a
l
M
e
d
i
c
a
l
G
o
v
e
r
n
m
e
n
t
G
o
v
e
r
n
m
e
n
t
w
a
s
t
e
s
(
2
%
)
F
i
g
u
r
e
5
.
V
o
l
u
m
e
o
f
l
o
w
-
l
e
v
e
l
n
u
c
l
e
a
r
w
a
s
t
e
s
f
r
o
m
v
a
r
i
o
u
s
s
o
u
r
c
e
s
[
L
e
a
g
u
e
,
1
9
8
5
]
.
P
i
e
g
r
a
p
h
s
c
o
m
p
a
r
e
p
a
r
t
s
o
f
a
w
h
o
l
e
F
i
g
u
r
e
6
.
E
s
t
i
m
a
t
e
d
a
n
n
u
a
l
d
o
s
e
o
f
r
a
d
i
a
t
i
o
n
i
n
t
h
e
U
n
i
t
e
d
S
t
a
t
e
s
[
G
P
U
N
u
c
l
e
a
r
,
1
9
8
5
]
.
A
v
e
r
a
g
e
d
o
s
e
:
1
6
0
m
r
e
m
N
a
t
u
r
a
l
S
o
u
r
c
e
s
M
e
d
i
c
a
l
S
o
u
r
c
e
s
8
5
m
r
e
m
7
0
m
r
e
m
{F
a
l
l
o
u
t
:
<
3
m
r
e
m
O
c
c
u
p
a
t
i
o
n
a
l
:
<
1
m
r
e
m
N
u
c
l
e
a
r
p
o
w
e
r
:
<
1
m
r
e
m
G
r
a
p
h
s
c
o
m
e
i
n
m
a
n
y
f
o
r
m
s
W
h
e
n
p
r
e
s
e
n
t
i
n
g
i
m
a
g
e
s
,
y
o
u
c
h
o
o
s
e
b
e
t
w
e
e
n
p
h
o
t
o
g
r
a
p
h
s
,
d
r
a
w
i
n
g
s
,
a
n
d
d
i
a
g
r
a
m
s
T
h
e
m
a
i
n
a
d
v
a
n
t
a
g
e
o
f
p
h
o
t
o
g
r
a
p
h
s
i
s
r
e
a
l
i
s
m
F
i
g
u
r
e
2
.
S
p
a
c
e
S
h
u
t
t
l
e
C
h
a
l
l
e
n
g
e
r
,
f
r
o
m
a
b
o
u
t
5
9
s
e
c
o
n
d
s
t
o
6
0
s
e
c
o
n
d
s
i
n
t
o
l
a
u
n
c
h
(
J
a
n
u
a
r
y
2
8
,
1
9
8
6
)
.
O
n
t
h
e
r
i
g
h
t
r
o
c
k
e
t
,
f
l
a
m
e
f
i
r
s
t
b
e
c
o
m
e
s
v
i
s
i
b
l
e
a
n
d
t
h
e
n
i
m
p
i
n
g
e
s
o
n
t
a
n
k
.
5
9
s
e
c
o
n
d
s
5
9
.
5
s
e
c
o
n
d
s
6
0
s
e
c
o
n
d
s
O
n
e
a
d
v
a
n
t
a
g
e
o
f
d
r
a
w
i
n
g
s
i
s
c
o
n
t
r
o
l
o
f
d
e
t
a
i
l
F
i
g
u
r
e
5
.
W
i
n
d
t
u
n
n
e
l
e
x
p
e
r
i
m
e
n
t
a
t
V
i
r
g
i
n
i
a
T
e
c
h
f
o
r
e
v
a
l
u
a
t
i
n
g
f
i
l
m
-
c
o
o
l
i
n
g
d
e
s
i
g
n
s
f
o
r
t
h
e
b
l
a
d
e
s
o
f
g
a
s
t
u
r
b
i
n
e
e
n
g
i
n
e
s
[
T
h
o
l
e
a
n
d
o
t
h
e
r
s
,
2
0
0
0
]
.
T
h
e
m
a
i
n
a
d
v
a
n
t
a
g
e
o
f
a
d
i
a
g
r
a
m
i
s
t
h
e
a
b
i
l
i
t
y
t
o
s
h
o
w
f
l
o
w
o
f
a
v
a
r
i
a
b
l
e
t
h
r
o
u
g
h
a
s
y
s
t
e
m
F
i
g
u
r
e
8
.
S
c
h
e
m
a
t
i
c
o
f
t
e
s
t
s
t
a
n
d
f
o
r
e
v
a
l
u
a
t
i
n
g
c
o
m
p
o
n
e
n
t
s
o
f
a
n
a
i
r
c
o
n
d
i
t
i
o
n
e
r
d
e
s
i
g
n
.
T
h
e
t
h
e
r
m
a
l
s
t
o
r
a
g
e
s
y
s
t
e
m
s
t
o
r
e
s
h
e
a
t
i
n
a
h
u
g
e
,
s
t
e
e
l
-
w
a
l
l
e
d
t
a
n
k
.
S
t
e
a
m
f
r
o
m
t
h
e
s
o
l
a
r
r
e
c
e
i
v
e
r
p
a
s
s
e
s
t
h
r
o
u
g
h
h
e
a
t
e
x
c
h
a
n
g
e
r
s
t
o
h
e
a
t
t
h
e
t
h
e
r
m
a
l
o
i
l
,
w
h
i
c
h
i
s
p
u
m
p
e
d
i
n
t
o
t
h
e
t
a
n
k
.
T
h
e
t
a
n
k
t
h
e
n
p
r
o
v
i
d
e
s
e
n
e
r
g
y
t
o
r
u
n
a
s
t
e
a
m
g
e
n
e
r
a
t
o
r
t
o
p
r
o
d
u
c
e
e
l
e
c
t
r
i
c
i
t
y
.
A
s
c
h
e
m
a
t
i
c
o
f
t
h
i
s
s
y
s
t
e
m
i
s
s
h
o
w
n
i
n
F
i
g
u
r
e
5
.
S
c
i
e
n
t
i
s
t
s
a
n
d
e
n
g
i
n
e
e
r
s
o
f
t
e
n
u
s
e
i
l
l
u
s
t
r
a
t
i
o
n
s
t
h
a
t
a
r
e
t
o
o
c
o
m
p
l
e
x
f
o
r
t
h
e
t
e
x
t
T
h
e
t
h
e
r
m
a
l
s
t
o
r
a
g
e
s
y
s
t
e
m
,
s
h
o
w
n
i
n
F
i
g
u
r
e
6
,
s
t
o
r
e
s
h
e
a
t
i
n
a
h
u
g
e
,
s
t
e
e
l
-
w
a
l
l
e
d
t
a
n
k
.
S
t
e
a
m
f
r
o
m
t
h
e
s
o
l
a
r
r
e
c
e
i
v
e
r
h
e
a
t
s
a
t
h
e
r
m
a
l
o
i
l
,
w
h
i
c
h
i
s
p
u
m
p
e
d
i
n
t
o
t
h
e
t
a
n
k
.
T
h
e
t
a
n
k
t
h
e
n
p
r
o
v
i
d
e
s
e
n
e
r
g
y
t
o
r
u
n
a
s
t
e
a
m
g
e
n
e
r
a
t
o
r
t
o
p
r
o
d
u
c
e
e
l
e
c
t
r
i
c
i
t
y
.
F
i
g
u
r
e
6
.
S
c
h
e
m
a
t
i
c
o
f
t
h
e
r
m
a
l
s
t
o
r
a
g
e
s
y
s
t
e
m
f
o
r
t
h
e
s
o
l
a
r
p
o
w
e
r
p
l
a
n
t
.
T
h
e
p
r
e
c
i
s
i
o
n
o
f
t
h
e
i
l
l
u
s
t
r
a
t
i
o
n
s
s
h
o
u
l
d
r
e
f
l
e
c
t
t
h
e
p
r
e
c
i
s
i
o
n
o
f
t
h
e
t
e
x
t
F
i
g
u
r
e
7
.
T
i
t
l
e
o
f
f
i
g
u
r
e
.
S
o
m
e
f
o
r
m
a
t
s
a
l
l
o
w
y
o
u
e
x
t
r
a
s
e
n
t
e
n
c
e
s
t
o
e
x
p
l
a
i
n
u
n
u
s
u
a
l
d
e
t
a
i
l
s
.
.
.
.
,
a
s
s
h
o
w
n
i
n
F
i
g
u
r
e
7
.
F
o
r
c
l
a
r
i
t
y
,
y
o
u
s
h
o
u
l
d
i
n
t
r
o
d
u
c
e
a
n
d
e
x
p
l
a
i
n
i
l
l
u
s
t
r
a
t
i
o
n
s
i
n
t
h
e
t
e
x
t
T
h
e
t
e
s
t
i
n
g
h
a
r
d
w
a
r
e
o
f
t
h
e
r
o
c
k
e
t
s
h
o
w
n
i
n
F
i
g
u
r
e
8
h
a
s
f
i
v
e
m
a
i
n
c
o
m
p
o
n
e
n
t
s
:
c
a
m
e
r
a
,
d
i
g
i
t
i
z
e
r
,
c
o
m
p
u
t
e
r
,
I
/
O
i
n
t
e
r
f
a
c
e
,
a
n
d
m
e
c
h
a
n
i
c
a
l
i
n
t
e
r
f
a
c
e
.
C
o
m
m
a
n
d
s
a
r
e
g
e
n
e
r
a
t
e
d
b
y
t
h
e
c
o
m
p
u
t
e
r
,
t
h
e
n
p
a
s
s
e
d
t
h
r
o
u
g
h
t
h
e
I
/
O
i
n
t
e
r
f
a
c
e
t
o
t
h
e
m
e
c
h
a
n
i
z
e
d
i
n
t
e
r
f
a
c
e
w
h
e
r
e
t
h
e
k
e
y
b
o
a
r
d
o
f
t
h
e
I
C
U
i
s
o
p
e
r
a
t
e
d
.
T
h
e
d
i
s
p
l
a
y
o
f
t
h
e
I
C
U
i
s
r
e
a
d
w
i
t
h
a
t
e
l
e
v
i
s
i
o
n
c
a
m
e
r
a
a
n
d
t
h
e
n
d
i
g
i
t
i
z
e
d
.
T
h
i
s
i
n
f
o
r
m
a
t
i
o
n
i
s
t
h
e
n
m
a
n
i
p
u
l
a
t
e
d
b
y
t
h
e
c
o
m
p
u
t
e
r
t
o
d
i
r
e
c
t
t
h
e
n
e
x
t
c
o
m
m
a
n
d
.
I
n
c
o
n
s
i
s
t
e
n
c
i
e
s
b
e
t
w
e
e
n
t
e
x
t
a
n
d
i
m
a
g
e
s
d
i
s
r
u
p
t
f
l
u
i
d
i
t
y
O
u
r
s
y
s
t
e
m
f
o
r
t
e
s
t
i
n
g
t
h
e
l
a
u
n
c
h
c
o
n
t
r
o
l
s
o
f
t
h
e
r
o
c
k
e
t
c
o
n
s
i
s
t
s
o
f
f
o
u
r
m
a
i
n
p
a
r
t
s
:
c
o
m
p
u
t
e
r
,
e
l
e
c
t
r
o
-
m
e
c
h
a
n
i
c
a
l
i
n
t
e
r
f
a
c
e
,
c
a
m
e
r
a
,
a
n
d
d
i
g
i
t
i
z
e
r
.
I
n
t
h
i
s
s
y
s
t
e
m
(
s
h
o
w
n
i
n
F
i
g
u
r
e
9
)
,
t
h
e
c
o
m
p
u
t
e
r
g
e
n
e
r
a
t
e
s
t
e
s
t
c
o
m
m
a
n
d
s
t
o
t
h
e
r
o
c
k
e
t
t
h
r
o
u
g
h
t
h
e
e
l
e
c
t
r
o
-
m
e
c
h
a
n
i
c
a
l
i
n
t
e
r
f
a
c
e
.
T
h
e
t
e
s
t
r
e
s
u
l
t
s
a
r
e
r
e
a
d
w
i
t
h
a
t
e
l
e
v
i
s
i
o
n
c
a
m
e
r
a
,
a
n
d
t
h
e
n
d
i
g
i
t
i
z
e
d
.
T
h
e
c
o
m
p
u
t
e
r
r
e
c
e
i
v
e
s
t
h
e
i
n
f
o
r
m
a
t
i
o
n
f
r
o
m
t
h
e
d
i
g
i
t
i
z
e
r
,
a
n
d
t
h
e
n
d
i
r
e
c
t
s
t
h
e
n
e
x
t
t
e
s
t
c
o
m
m
a
n
d
.
F
i
g
u
r
e
9
.
S
y
s
t
e
m
t
o
t
e
s
t
l
a
u
n
c
h
c
o
n
t
r
o
l
s
f
o
r
r
o
c
k
e
t
.
I
l
l
u
s
t
r
a
t
i
o
n
i
s
t
h
e
m
e
s
h
i
n
g
o
f
w
o
r
d
s
w
i
t
h
i
m
a
g
e
s
This content delves into the intersection of words and images, showcasing illustrations depicting nuclear reactor power levels, sequence of events in the Chernobyl accident, blood glucose levels, and temperature data in engineering. Explore how different forms of data visualization, such as tables, figures, line graphs, and bar graphs, are employed to convey complex information effectively in scientific and engineering contexts. Gain insights into the visualization of numerical data and the use of images to enhance understanding.

Download Presentation

Please find below an Image/Link to download the presentation.
The content on the website is provided AS IS for your information and personal use only. It may not be sold, licensed, or shared on other websites without obtaining consent from the author. Download presentation by click this link. If you encounter any issues during the download, it is possible that the publisher has removed the file from their server.
E N D
Presentation Transcript
Illustration: The Meshing of Words With Images Keep it as simple as possible, yet no simpler. Albert Einstein X-ray photograph of DNA [Rosalind Franklin, 1952]
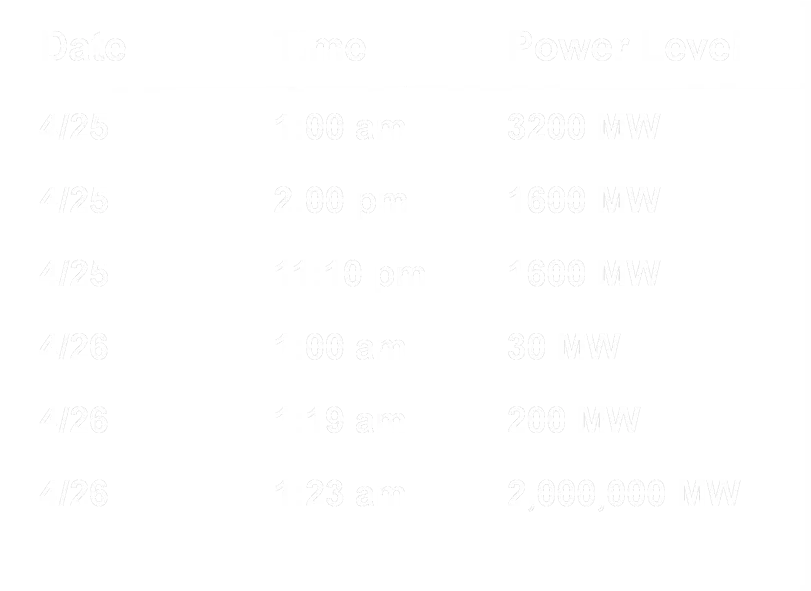
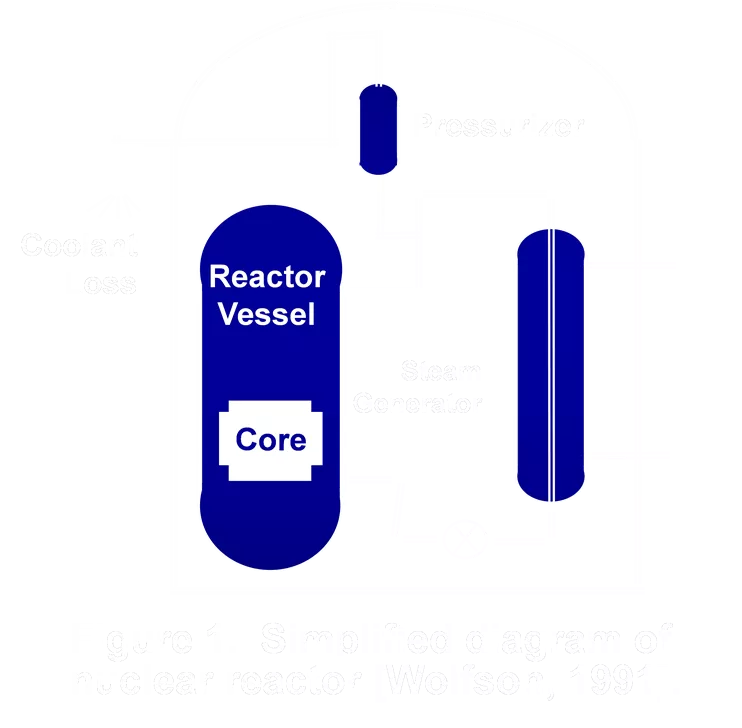
Two types of illustrations exist: tables and figures Table 1. Reactor power levels in Chernobyl accident [Wolfson, 1991]. Pressurizer Date Time Power Level 4/25 1:00 am 3200 MW Coolant Loss Reactor Vessel 4/25 2:00 pm 1600 MW Steam 4/25 11:10 pm 1600 MW Generator Core 4/26 1:00 am 30 MW 4/26 1:19 am 200 MW 4/26 1:23 am 2,000,000 MW Figure 1. Simplified diagram of nuclear reactor [Wolfson, 1991].
Tables can present words as well as numbers Table 2. Sequence of events in the Chernobyl accident [Wolfson, 1991]. Date Time Power Level Event April 25 1:00 a.m. 3200 MW Operators begin power descent April 25 2:00 p.m. 1600 MW Power descent delayed for 9 hours Emergency core-cooling system disconnected April 25 11:10 p.m. 1600 MW Operators switch off automatic control Power descent resumed April 26 1:00 a.m. 30 MW Power minimum reached April 26 1:19 a.m. 200 MW Operators pull rods beyond allowable limits Operators start two additional coolant pumps Operators violate coolant flow limits April 26 1:23 a.m. 2,000,000 MW Power surges by factor of 10,000 in 5 seconds
When presenting numerical data, you choose between tables and graphs Table 2. Blood glucose levels [Carlson, 1982]. Breakfast 300 Dinner Lunch 250 Normal (mg/dl*) Diabetic (mg/dl) Time (hour) Diabetic Blood Glucose Level (mg/dl) 200 100.3 93.6 88.2 100.5 138.6 102.4 93.8 132.3 103.8 93.6 127.8 109.2 175.8 165.7 159.4 72.1 271.0 224.6 161.8 242.7 219.4 152.6 227.1 221.3 midnight 2:00 4:00 6:00 8:00 10:00 noon 2:00 4:00 6:00 8:00 10:00 150 100 Normal 50 0 12:00 6:00 am 12:00 6:00 pm 12:00 Hour * decaliters/milligram Figure 11. Blood glucose levels for normal individual and diabetic [Carlson, 1982].
Line graphs are common in engineering and science 2000 1500 Temperature (K) 1000 Experiment Simulation 500 0 0 2 4 6 8 10 Distance From Burner (mm) Figure 3. Computational and experimental temperatures for laminar diffusion flames [Sandia, 1987].
Bar graphs compare wholes 30 Normal range 20 7-10 Cells% 10 112 175 211 366 Flight Duration (Days) Figure 4. Response of T-cells in cosmonauts after short-term and long-term flights [Konstantinova, 1991].
Gantt charts are a type of bar charts Task 1979 1981 1983 1985 1987 1989 Construction Test and Evaluation Power Production Figure 5. Schedule for the construction, evaluation, and production phases of the Solar One Power Plant.
Pie graphs compare parts of a whole Power Reactor Industrial Medical Government Government wastes (2%) Medical and research wastes (16%) Industrial wastes (28%) Power reactor wastes (64%) Figure 5. Volume of low-level nuclear wastes from various sources [League, 1985].
Graphs come in many forms Natural Sources 85 mrem Medical Sources { 70 mrem Average dose: 160 mrem Fallout: < 3mrem Occupational: < 1mrem Nuclear power: < 1mrem Figure 6. Estimated annual dose of radiation in the United States [GPU Nuclear, 1985].
When presenting images, you choose between photographs, drawings, and diagrams 4 1 Combustor 3 2 Compressor Turbine
The main advantage of photographs is realism 60 seconds 59.5 seconds 59 seconds Figure 2. Space Shuttle Challenger, from about 59 seconds to 60 seconds into launch (January 28, 1986). On the right rocket, flame first becomes visible and then impinges on tank.
One advantage of drawings is control of detail Combustor Simulator Turbine Vanes Secondary Flow Dilution Jet Primary Flow Secondary Flow Film-Cooling Holes Figure 5. Wind tunnel experiment at Virginia Tech for evaluating film-cooling designs for the blades of gas turbine engines [Thole and others, 2000].
The main advantage of a diagram is the ability to show flow of a variable through a system Figure 8. Schematic of test stand for evaluating components of an air conditioner design.
Scientists and engineers often use illustrations that are too complex for the text The thermal storage system stores heat in a huge, steel- walled tank. Steam from the solar receiver passes through heat exchangers to heat the thermal oil, which is pumped into the tank. The tank then provides energy to run a steam generator to produce electricity. A schematic of this system is shown in Figure 5. DSPH RECEIVER TSU TSH FLASH TANK FT T S S G TURBINE DEAR- ATOR HOT WELL HP HTR Figure 5. Schematic of thermal storage system.
The precision of the illustrations should reflect the precision of the text The thermal storage system, shown in Figure 6, stores heat in a huge, steel-walled tank. Steam from the solar receiver heats a thermal oil, which is pumped into the tank. The tank then provides energy to run a steam generator to produce electricity. 650 F 580 F 530 F 575 F Thermal Tank Heat solar receiver Heat steam generator Exchanger Exchanger 425 F 435 F 425 F 250 F Figure 6. Schematic of thermal storage system for the solar power plant.
For clarity, you should introduce and explain illustrations in the text ..., as shown in Figure 7. Figure 7. Title of figure. Some formats allow you extra sentences to explain unusual details.
Inconsistencies between text and images disrupt fluidity The testing hardware of the rocket shown in Figure 8 has five main components: camera, digitizer, computer, I/O interface, and mechanical interface. Commands are generated by the computer, then passed through the I/O interface to the mechanized interface where the keyboard of the ICU is operated. The display of the ICU is read with a television camera and then digitized. This information is then manipulated by the computer to direct the next command. CONTROL TERMINAL PRINTER CAMERA COMPUTER DIGITIZER ELECTRO- MECHANICAL INTERFACE ROCKET Figure 8. Testing hardware.
Illustration is the meshing of words with images Our system for testing the launch controls of the rocket consists of four main parts: computer, electro-mechanical interface, camera, and digitizer. In this system (shown in Figure 9), the computer generates test commands to the rocket through the electro- mechanical interface. The test results are read with a television camera, and then digitized. The computer receives the information from the digitizer, and then directs the next test command. 2 Electro- Mechanical Interface 1 Computer Rocket 3 4 Camera Digitizer Figure 9. System to test launch controls for rocket.