Hyperbolas and Circles
This content discusses the characteristics and transformations of hyperbolas and circles, including their equations, graphs, asymptotes, and locator points. It explains standard forms and the impacts of h and k values on the functions. Explore the concepts with examples and detailed explanations.

Download Presentation

Please find below an Image/Link to download the presentation.
The content on the website is provided AS IS for your information and personal use only. It may not be sold, licensed, or shared on other websites without obtaining consent from the author.If you encounter any issues during the download, it is possible that the publisher has removed the file from their server.
You are allowed to download the files provided on this website for personal or commercial use, subject to the condition that they are used lawfully. All files are the property of their respective owners.
The content on the website is provided AS IS for your information and personal use only. It may not be sold, licensed, or shared on other websites without obtaining consent from the author.
E N D
Presentation Transcript
Learning Targets To recognize and describe the characteristics of a hyperbola and circle. To relate the transformations, reflections and translations of a hyperbola and circle to an equation or graph
Hyperbola A hyperbola is also known as a rational function and is expressed as Parent function and Graph: ? ? =1 ? y 4 3 2 1 x -4 -3 -2 -1 1 2 3 4 -1 -2 -3 -4
Hyperbola Characteristics y The characteristics of a hyperbola are: Has no vertical or horizontal symmetry There are both horizontal and vertical asymptotes The domain and range is limited 4 3 2 1 x -4 -3 -2 -1 1 2 3 4 -1 -2 -3 -4
Locator Point y The locator point for this function is where the horizontal and vertical asymptotes intersect. 4 3 2 1 x -4 -3 -2 -1 1 2 3 4 -1 -2 Therefore we use the origin, (0,0). -3 -4
Standard Form 1 ? ? = ? + ? ? Vertical Translation Reflects over x-axis when negative Horizontal Translation (opposite direction) Vertical Stretch or Compress Stretch: ? > 1 Compress: 0 < ? < 1
Impacts of h and k y Based on the graph at the right what inputs/outputs can our function never produce? 4 3 2 1 x -4 -3 -2 -1 1 2 3 4 -1 This point is known as the hyperbolas hole -2 -3 -4
Impacts of h and k The coordinates of this hole are actually the values we cannot have in our domain and range. y 4 3 2 1 x -4 -3 -2 -1 1 2 3 4 -1 Domain: all real numbers for ? Range: all real numbers for ? ? -2 -3 -4
Impacts of h and k y This also means that our asymptotes can be identified as: 4 3 2 1 x Vertical Asymptote: x=h -4 -3 -2 -1 1 2 3 4 -1 -2 Horizontal Asymptote: y=k -3 -4
Example #1 What is the equation for this graph? y 11 10 9 8 7 6 5 4 3 2 x 1 -9 -8 -7 -6 -5 -4 -3 -2 -1 1 2 3 4 5 6 7 8 9 10 11 12 -1 -2 -3 -4 -5 1 -6 ? ? = 2 -7 ? 3 -8 -9 -10
Example #2 You try: y 7 6 5 4 3 2 (-3,2) 1 x -9 -8 -7 -6 -5 -4 -3 -2 -1 1 2 3 4 5 6 7 8 9 -1 1 ? ? = + 1 -2 ? + 4 -3 -4
Impacts of a Our stretch/compression factor will once again change the shape of our function. y 4 3 The multiple of the factor will will determine how close our graph is to the hole 2 1 x -4 -3 -2 -1 1 2 3 4 -1 The larger the a value, the further away our graph will be. -2 -3 -4 The smaller the a value , the closer our graph will be.
Example #3 What is the equation for this function: y 9 8 7 6 5 4 (3,3) 3 2 x 1 -9 -8 -7 -6 -5 -4 -3 -2 -1 1 2 3 4 5 6 7 8 9 10 11 -1 -2 -3 -4 1 ?+2 -5 ? ? = 3 -6 -7 -8 -9 -10
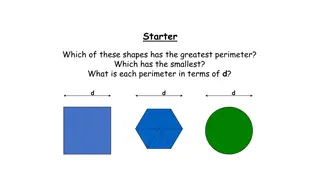
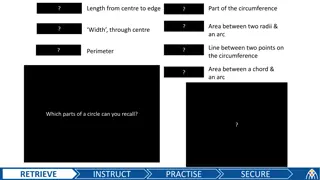
The equation of a circle What characterizes every point (x, y) on the circumference of a circle?
Every point (x, y) is the same distance r from the center. Therefore, according to the Pythagorean distance formula for the distance of a point from the origin.
Parent Function ?2+ ?2= ?2 Where r is the radius. The center of the circle, (0,0) is its Locator Point.
Examples State the coordinates of the center and the measure of radius for each. 1)x + y = 64 2)(x-3) + y = 49 3)x + (y+4) = 25 4)(x+2) + (y-6) = 16
Now lets find the equation given the graph: y 8 7 6 5 4 3 2 1 x -9 -8 -7 -6 -5 -4 -3 -2 -1 1 2 3 4 5 6 7 8 9 -1 x + (y-3) = 4 -2 -3 -4
Now lets find the equation given the graph: y (x-3) + (y-1) = 25 7 6 5 4 3 2 x (-2,1) 1 -9 -8 -7 -6 -5 -4 -3 -2 -1 1 2 3 4 5 6 7 8 9 -1 -2 -3 -4
Homework Worksheet #6 GET IT DONE NOW!!! ENJOY YOUR BREAK!!!


 is the")