Higher Education Funding Challenges and Impact on University Operations
Senate Budget Committee Report outlines a significant decrease in state appropriations for higher education institutions since 2001, leading to a substantial increase in tuition fees. The report also highlights budget estimates, funding priority shifts affecting faculty numbers, and financial challenges faced by university auxiliary units.
Download Presentation

Please find below an Image/Link to download the presentation.
The content on the website is provided AS IS for your information and personal use only. It may not be sold, licensed, or shared on other websites without obtaining consent from the author. Download presentation by click this link. If you encounter any issues during the download, it is possible that the publisher has removed the file from their server.
E N D
Presentation Transcript
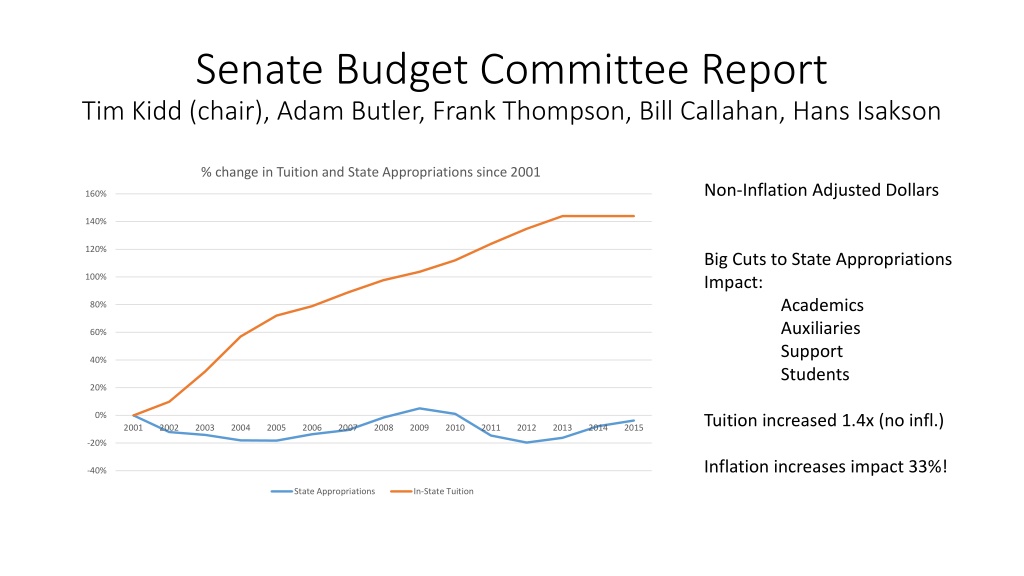
Senate Budget Committee Report Tim Kidd (chair), Adam Butler, Frank Thompson, Bill Callahan, Hans Isakson % change in Tuition and State Appropriations since 2001 Non-Inflation Adjusted Dollars 160% 140% 120% Big Cuts to State Appropriations Impact: Academics Auxiliaries Support Students 100% 80% 60% 40% 20% 0% Tuition increased 1.4x (no infl.) 2001 2002 2003 2004 2005 2006 2007 2008 2009 2010 2011 2012 2013 2014 2015 -20% Inflation increases impact 33%! -40% State Appropriations In-State Tuition
Near Term Outlook Near Term Outlook Change 14-15 FY15 Budget Estimate for 2016 $89,176,732.00 2001 Appr. = $96.8M Infl. Adj. = $129.2M 2015 Appr = $89.2M 44% effective reduction FY14 Budget Change 15-16 state base state 1 time Interest tuition UR tuition UNR tuition GR tuition GNR new student Total Tuition Indirect Sales $83,222,819.00 $6,000,000.00 ($2,000,000.00) $821,000.00 $57,550,029.00 $12,333,414.00 $5,414,771.00 $763,422.00 $0.00 $76,061,636.00 $1,316,649.00 $483,393.00 $167,905,497.0 0 $5,953,913.00 $89,176,732.00 $4,000,000.00 $(4,000,000.00) $821,000.00 $57,550,029.00 $12,641,749.00 $5,523,066.00 $782,508.00 $392,232.00 $76,889,584.00 $1,316,649.00 $483,393.00 $172,687,358.0 0 $0.00 $0.00 $0.00 $0.00 $0.00 $0.00 $0.00 $0.00 $0.00 $0.00 $0.00 $0.00 $0.00 $821,000.00 $57,550,029.00 $12,641,749.00 $5,523,066.00 $782,508.00 $392,232.00 $76,889,584.00 $1,316,649.00 $483,393.00 $168,687,358.0 $308,335.00 $108,295.00 $19,086.00 $392,232.00 $827,948.00 Impacts ALL areas of UNI Base increase for FY15 = $6M Needed increase in FY16 ~ $8M Loss of 1 time $ and raises/etc Legislature cut ~ $1.4M from governors proposal FY15 $0.00 $0.00 total revenue $4,781,861.00 $0.00 0 personnel expenses non-personnel expenses financial aid institutional accounts Contingency Fund $133,836,989.0 $137,133,791.0 $140,430,593.0 $3,296,802.00 $3,296,802.00 0 0 0 $12,589,462.00 $0.00 $12,589,462.00 $0.00 $12,589,462.00 Clearer picture this fall Efficiency study Performance Based Funding $13,692,016.00 $9,149.00 $13,701,165.00 $9,149.00 $13,710,314.00 $8,041,397.00 $313,604.00 $8,355,001.00 $313,604.00 $8,668,605.00 $0.00 $1,329,600.00 $1,329,600.00 $0.00 $1,329,600.00 Financial reserves ~ $2M No signs of sneaky money transfers Numbers complex Unrestricted Funds NOT unrestricted $168,159,864.0 $173,109,019.0 $176,728,574.0 total expense $4,949,155.00 $3,619,555.00 0 0 0 Net ($254,367.00) ($167,294.00) ($421,661.00) ($167,294.00) ($8,041,216.00)
Funding Priority Shifts: Faculty Numbers 10.0% 5.0% 178 Asst. Prof. in 2001 119 Asst. Prof in 2013 Drop of ~ 30% 0.0% 2001200220032004200520062007200820092010201120122013 -5.0% -10.0% Part Time Non Tenure-Track -15.0% Tenure Track -20.0% Part Time Adjuncts Increased Hard to tell FTE impact -25.0% -30.0% -35.0% -40.0% Overall Student-Faculty ratio not overly changed Serious impact on students adjuncts don t provide extra-curricular opportunities in research/outreach/independent study. Service load of faculty increases & less long term investement by faculty in UNI
Auxiliary Units: General Ed Fund 2009-2010 172,120,593.85 2010-2011 161,704,799.10 2011-2012 161,486,788.60 2012-2013 167,114,885.32 General Educational Fund Revenue Auxiliary Enterprises GEF Received Residence Athletics Mauker Union Field House GBPAC WRC Student Health System Miscellaneous Total Auxiliary Enterprises Field house - 4,449,174.00 619,837.00 750,464.40 851,328.00 874,692.00 420,411.00 - 7,215,442.00 - 4,559,447.00 598,286.00 0 848,739.00 782,274.00 188,213.00 - 6,976,959.00 - 4,323,026.00 603,570.00 0 812,802.00 766,716.00 197,469.00 - 6,703,583.00 - 4,198,513.00 676,292.00 0 828,011.00 781,150.00 200,554.00 - 6,684,520.00 % of GEF that go to Aux. Enterprises 4.63 4.31 4.15 4.00 % of GEF that go to Athletics 2.58 2.82 2.68 2.51 Have not looked closely into other areas such as foundation, OSRP, centers, etc
Funding Priority Shifts: Salaries (with Fringe) as % of overall salaries Auxiliary and administration Salary % have increased since 2003 Large increase in athletics Instruction Salary % has decreased since 2003 Effectively adjusted for inflation trends For comparison purposes Caveats 2010-2011 have some anomalies Work with finance to get clearer picture Not all auxiliary revenues from Gen fund Athletics has done great job with ext. funding % Change in Salary Levels as a percentage of total UNI Salary since 2003 40.00% 35.00% 30.00% 25.00% 20.00% 15.00% 10.00% 5.00% 0.00% 2003 2004 2005 2006 2007 2008 2009 2010 2011 2012 -5.00% -10.00% -15.00% Faculty (from instruction) Institutional support Auxiliary enterprises Athletic salaries
Financials in Athletics Great overall job External funding Work well with foundation also $ to athletics from donor intent % Change in Athletics Financials Since 2003 180.0% 160.0% 140.0% 120.0% One concern Net liability >$700k Majority unpaid vacation/leave 100.0% 80.0% 60.0% GEF support reduced since 2008 Still 7% higher than 2003 Auxiliary units charged new costs in past 5 years Overhead and partial utilities 40.0% 20.0% 0.0% 2003 2004 2005 2006 2007 2008 2009 2010 2011 2012 Percentage Change in Revenue (not including GEF, NCAA, Student Fee, Foundation) Percentage Change in Salaries Consider ten year cuts to instruction and academic areas Staffing, overall salary comparison, S&S budgets stagnant Long term cuts to instruction/academics larger Percentage Change in Expenses (incl. Salaries) Percentage Change in GEF Support (Net Transfers In)
MPLS Closure Complex Financials Uncounted Impacts: Deferred maintenance Need for new building State per-pupil funding MPLS Enrollment UNI enrollment Saved millions in building costs 189 less UNI education majors (8%) Impact on enrollment in millions? Net result: reallocation of resources
Specific Cuts Unintended Consequences Also examined donations to foundation No impacts seen Large single year variations Baseball cut in 2009 (Fall 2009) Resource reallocation in response to budget cuts MPLS / Program Closures in 2012 (Fall 2012) Most faculty felt no consultation Seemed fast response to big cuts Big drop in enrollment / tuition revenue Efficiency Study / FY16 Funding Need to prepare, prioritize Be ready to respond to suggested cuts Preparation may help mitigate unintended consequences UNI is running very lean in all areas after big cuts, should be prepared for future % Change in Enrollment / Entering Class as Compared to 2006 10.00% 8.00% 6.00% 4.00% 2.00% 0.00% 2006 2007 2008 2009 2010 2011 2012 2013 -2.00% -4.00% -6.00% -8.00% Enrollment (UG) Incoming UG Class
Suggestions Future Thoughts Have had success working with administration / finance Over past year administration is very interested in transparency And improvement in faculty-administration relations We should work as partners to enhance institution Budget Prioritization Current Budget committee looks at history / health / trends Expand mandate? Would need more members, preferably 2 senators Need to make better model for assessing current priorities Consult with finance / administration and report to senate on priorities Curriculum / Program Review Prepare to Defend, Justify, and Promote Efficiency study (maybe?)looks only at undergrad programs on academic side. Urgency? Will be looking at numbers retention, grad rates, class size, student credit hours, etc Need to be aware of what they will be looking at. Identify at-risk departments. Identify other important metrics? placement after graduation, student opportunities, education quality, research, outreach, external funding, etc . Questions: Should senate budget committee be involved with financial planning? Are there areas of interest that we should look at this year (performance based funding?)


