GTA Commercial Real Estate Trends 2020 Symposium
The GTA Commercial Real Estate in Perspective symposium held in February 2020 provided insights into market updates, emerging trends, and challenges faced by the industry. Discussions centered on capital markets, property types, suburban mixed-use redevelopments, and the impact of climate change on real estate values. The event highlighted the shift towards Surban living, the rise of PropTech, and the importance of adapting to changing environmental conditions for sustainable growth in the sector.

Download Presentation

Please find below an Image/Link to download the presentation.
The content on the website is provided AS IS for your information and personal use only. It may not be sold, licensed, or shared on other websites without obtaining consent from the author.If you encounter any issues during the download, it is possible that the publisher has removed the file from their server.
You are allowed to download the files provided on this website for personal or commercial use, subject to the condition that they are used lawfully. All files are the property of their respective owners.
The content on the website is provided AS IS for your information and personal use only. It may not be sold, licensed, or shared on other websites without obtaining consent from the author.
E N D
Presentation Transcript
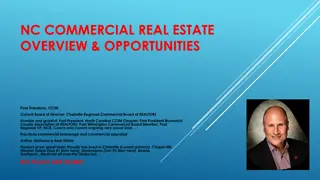
GTA Commercial Real Estate in Perspective CPTA Ontario Chapter 2020 Symposium February 25th, 2020 - National Club, Toronto Raymond Wong, Vice President, Data Operations, Data Solutions Altus Group
AGENDA New Decade 1 Capital markets update 2 Commercial market update 3 Closing remarks 4
A new decade, a new beginning sort of.
Trends in the past decadeto continue WeWork, co-working space, improved office amenities Suburban locations + urban amenities = Surban PropTech Immersive food & retail experiences Source: WeWork, MetroNaps ,Shop Square One, Eataly Toronto 4 altusgroup.com
Suburban mixed-use redevelopment Sherway Gardens Square One Cloverdale Mall Source: Cadillac Fairview Corporation, City of Toronto, Oxford Properties, Retail Insider 5 altusgroup.com
Climate change are we ready? 100-year storm scenario = 99.8 mm of rain in 10 hours August 2018 Over 70 mm in two hours The 6th 100-year event in the GTA in past two decades Hurricane Hazel (1956) 18 mm per hour Source: Toronto Life, Toronto Star, TVO, Conservation Halton, FloodList 6 altusgroup.com
Why does this matter? Potential impact to real estate values & returns 166 mm of rain in a single day by 2050 100-year events are becoming the norm; more frequent, more severe, less predictable Higher premiums and insurance payouts Source: Toronto Life, Toronto Star, TVO, Conservation Halton, FloodList 7 altusgroup.com
What investors want Property type barometer all available products (Q4 2019) 8.0 MOMENTUM RATIO (BUY % / SELL %) 6.0 4.0 2.0 0.0 -2.0 -4.0 Source: Altus Group (Investment Trends Survey) 9 altusgroup.com
National investment activity down 9% in 2019 $70B $59.1B $60B $53.9B Q1-Q3 2018 Q1-Q3 2019 $50B BILLIONS $40B $30B $22.6B $21.0B $20B $17.0B $9.2B $8.8B $10B $6.5B $5.1B $4.9B $3.8B $3.7B $3.3B $2.7B $2.4B $2.0B 0 Vancouver Edmonton Calgary GTA GGH Ottawa Montreal National* *National summaries include: commercial arm s length market transactions and share sales > $1 million Source: Altus Group 10 altusgroup.com
GTA 2019 investment activity, up slightly from 2018. (Dollar volume and # of transactions) 304 34 516 Residential Land Residential Lots LAND 418 29 357 ICI Land # of Transactions 227 220 OFFICE 518 RETAIL 546 516 INDUSTRIAL 520 194 APARTMENT 229 8 HOTEL 9 $1B $2B $3B $4B $6B $7B $5B $8B Source: Altus Group 11 altusgroup.com
GTA cap rate trends 8.5 Downtown Class "AA" Office Tier I Regional Mall Single Tenant Industrial Suburban Multiple Unit Residential 4 Asset Class Average 8.0 7.5 7.0 CAP RATE (%) 6.5 6.0 5.5 5.0 4.5 4.0 3.5 3.0 Q1 Q2 Q3 Q4 Q1 Q2 Q3 Q4 Q1 Q2 Q3 Q4 Q1 Q2 Q3 Q4 Q1 Q2 Q3 Q4 Q1 Q2 Q3 Q4 Q1 Q2 Q3 Q4 Q1 Q2 Q3 Q4 Q1 Q2 Q3 Q4 Q1 Q2 Q3 Q4 Q1 Q2 Q3 Q4 Q1 Q2 Q3 Q4 Q1 Q2 Q3 Q4 Q1 Q2 Q3 Q4 Q1 Q2 Q3 Q4 2005 2006 2007 2008 2009 2010 2011 2012 2013 2014 2015 2016 2017 2018 2019 Source: Altus Group (Investment Trends Survey) 12 altusgroup.com
GTA office transactions 111 PETER STREET Toronto, ON 2201 EGLINTON AVENUE E & 888 BIRCHMOUNT ROAD Scarborough, ON Date: December 2019 Price: $185M Price / sq.ft.: $734 Cap rate: 4.5% Date: July 2019 Price: $105M Price / sq.ft.: $244 Cap rate: 5.5% Source: Altus Group 13 altusgroup.com
GTA industrial transactions 2200 YUKON COURT Milton, ON 80 VIA RENZO DRIVE Richmond Hill, ON 45 PARLIAMENT STREET Toronto, ON Date: December 2019 Price: $180.1M Price / sq.ft.: $164 Cap rate: 4.5% Date: September 2019 Price: $215M Price / sq.ft.: $1,820 Date: December 2019 Price: $223M Price / sq.ft.: $920 Source: Altus Group 14 altusgroup.com
GTA retail transactions STOCKYARDS VILLAGE Toronto, ON HALTON HILLS VILLAGE Halton Hills, ON Date: May 2019 Price: $88.5M Adjusted price / sq.ft.: $351 Date: December 2019 Price: $42.2M Price / sq.ft.: $378 Cap rate: 5.8% Source: Altus Group 15 altusgroup.com
Capital watch Retail in secondary markets will continue struggle with liquidity Redevelopment / densification opportunities continued cap rate pressures Apartment and industrial will continue to be hot, especially properties with potential upside Foreign and domestic investor demand will remain strong 16 altusgroup.com
Top office tenant preferences 1. Abundant natural light 2. Coffee shops 3. Free WiFi 4. Room sensors - temperature control 6. Sound proofing 7. Ability to receive packages 5. Efficient elevators Source: Informa, 2019 Office Tenant Preference Survey 18 altusgroup.com
Health, wellness, employee-centric amenities Lifestyle choices & physical / social environments determine 90% of health. - WELL Building Institute BDO Offices, Toronto 70% of employees say that a workplace that enhances their health and well-being would encourage them to stay at current job or accept a job offer. Nap it Up daytime napping studio for office tower workers at Yonge & Eglinton - 2019 Workplace Wellness Study, Future Workplace Source: WELL Building Institute, Workplace Wellness Study, Forbes, Toronto Life, Office Snapshots / Claude-Simon Langlois 19 altusgroup.com
Challenges with open workspaces Wear Space by Panasonic: Wireless, noise-canceling headphones and U-shaped fabric limits vision and creates personal space Source: CBC / Onetwosix Design / The Japan Times 20 altusgroup.com
Office vacancy rate in balance for the most part 25% 21.8% 20.7% 20% VACANCY RATE 14.9% 14.9% 14.7% 14.3% 15% 12.3% 10.0% 9.3% 10% 8.1% 7.7% 7.1% 6.8% 6.5% 5.3% 4.5% 5% 0% Vancouver Edmonton Calgary Toronto Ottawa Montreal Quebec City Halifax Q4 2018 Q4 2019 Source: Altus Group 21 altusgroup.com
Strong office pre-leasing activity 22 80% 20 70% 69% 18 60% 16 14 50% SQ. FT. (MILLIONS) % AVAILABLE 12 42% 40% 10 35% 32% 30% 8 26% 6 20% 4 15% 10% 2 6% 0% 0% 0 0% Vancouver Edmonton Calgary Winnipeg Toronto Ottawa Montreal Halifax National Under Construction % Available Source: Altus Group 22 altusgroup.com
2019 GTA office leasing activity Manufacturing 5% 353,000 sq. ft. Sublet leases 4% (300,000 sq. ft.) Co-working 4% 275,000 sq. ft. Tech 19% 1.3M sq. ft. Expansion & renewals 25% (1.9 million sq. ft.) Government -11% 750,000 sq. ft. New-build leases - 26% (2 million sq. ft.) Business / professional services 24% 1.7M sq. ft. Financial 37% 2.6M sq. ft. New leases 45% (3 million sq. ft.) BY SECTOR Source: Altus Group 23 altusgroup.com
Downtown office under construction - is there an appetite for more? With construction costs expected to increase 10-15% over the next five years, need rents of $95+ to justify new builds 3,000,000 12% 2,500,000 10% AVAILABILITY RATE $95+ 2,000,000 8% $85 SQ. FT. 1,500,000 6% $75 1,000,000 4% $75 500,000 2% 0 0% 2010 2011 2012 2013 2014 2015 2016 2017 2018 2019 2020 2021 2022 2023 2024 10.5% IRR expectation T&O 50/50 of gross rent Replacement cost 3.5% escalation New build rents Leased Available Availability rate Source: Altus Group 24 altusgroup.com
Office watch Suburban office will struggle with older supply and public transit accessibility Downtown Toronto still has plenty of runway despite new supply Flexibility and talent is key; co-working will continue to grow Not much relief for tenants in short to medium term 25 altusgroup.com
Efficiencies its whats inside of the building that matters Grocery focus warehouse space Source: CBC News, Walmart, Fortune 27 altusgroup.com
The good, bad and ugly: effects of reverse logistics In the US alone, returned online purchases generate annually 5 BILLION POUNDS OF WASTE 15 MILLION TONNES OF CARBON EMISSONS Source: The Atlantic / Reuters / Lucas Jackson / BBC Earth / NBC 28 altusgroup.com
Industrial sector remains undersupplied, while demand strengthens 10% 9.5% 9.2% 9% 8.3% 8.2% Q4 2018 Q4 2019 8% 7% AVAILABILITY RATE 6% 5.0% 5% 4.1% 4.1% 4.0% 4.0% 3.8% 4% 3.6% 3.3% 3.0% 2.9% 3% 2.1% 1.9% 2% 1% 0% Vancouver Edmonton Calgary Toronto Southwestern Ontario Ottawa Montreal National Source: Altus Group 29 altusgroup.com
Pre-leasing activity in new buildings under construction has been strong 25M 100% 100.0% 20M 80% 70.0% SQ. FT. (MILLIONS) 15M 60% % AVAILABLE 10M 40% 36.9% 34.7% 32.6% 5M 20% 13.7% 5.6% 0 0% Vancouver Edmonton Calgary Toronto Ottawa Montreal National Under Construction % Available Source: Altus Group 30 altusgroup.com
2019 GTA industrial sales and leasing activity New leases 59% (11.9 million sq. ft.) User sales 29% (6 million sq. ft.) Expansion & renewals 11% (2.2 million sq. ft.) Sublet leases 1% (142,000 sq. ft.) Source: Altus Group 31 altusgroup.com
GTA industrial forecast Availability rate vs. Total new supply forecast vs. Absorption (Greater Toronto Area, 2009-2024) 15 8% TOTAL NEW SUPPLY / ABSORPTION 7% AVAILABILITY RATE (%) 12 6% (SQ.FT. MILLIONS) 5% 9 4% 6 3% 2% 3 1% 0 0% 2009 2010 2011 2012 2013 2014 2015 2016 2017 2018 2019 2020 2021 2022 2023 2024 New Supply Absorption Availability Rate Source: Altus Group 32 altusgroup.com
Will rising industrial rental rates push new supply further away from the GTA? 4.0% $20 $18 3.5% $16 AVAILABILITY RATE 3.0% $14 2.5% $12 $ PSF 2.0% $10 $8 1.5% $6 1.0% $4 0.5% $2 0.0% $0 2016 2017 2018 2019 2020 2021 2022 2023 2024 New build gross rents Existing stock gross rents Availability rate 11.5% IRR expectation T&O 50/50 of gross rent Replacement cost 3.5% escalation Source: Altus Group 33 altusgroup.com
Industrial watch Sale prices will continue to climb, driven by users and investors Rental rates will generally increase, accelerating new modern facilities Tenants will focus on automation and efficiencies 34 altusgroup.com
Commercial market summary and outlook The GTA is positioned for another solid year of real estate investment across all major asset classes Office demand remains strong and the new supply is expected to be readily absorbed readily absorbed supported by the economic growth in the GTA Demand for industrial spaces continues to exceed supply - - keeping upward pressure on lease rates, and vacancies low 36 altusgroup.com
Considerations in 2020 and beyond PropTech disruption has reached the tipping point and we are seeing wide spread adoption - in both commercial and residential assets Given the tight market in assets and sectors the GTA is well positioned to benefit from PropTech Climate change is on the minds of consumers, investors, and owners Expect more attention to building standards, efficiency, reporting, and location in years ahead The next decade will bring the rise of Gen Z Their impact on residential and retail sectors will be profound, but their desires will impact all sectors of real estate 37 altusgroup.com