Ground-Level Ozone Pollution: Health Effects and Historical Perspective
Ground-level ozone, a secondary pollutant formed by NOx and VOCs, poses significant health risks such as lung inflammation and respiratory illnesses. This article delves into the adverse effects of ozone inhalation, regulatory efforts, and a historical perspective, including the alarming levels recorded in Los Angeles in the 1950s and 1960s. It also highlights the ambient air quality standards set by both federal and California agencies.

Download Presentation

Please find below an Image/Link to download the presentation.
The content on the website is provided AS IS for your information and personal use only. It may not be sold, licensed, or shared on other websites without obtaining consent from the author.If you encounter any issues during the download, it is possible that the publisher has removed the file from their server.
You are allowed to download the files provided on this website for personal or commercial use, subject to the condition that they are used lawfully. All files are the property of their respective owners.
The content on the website is provided AS IS for your information and personal use only. It may not be sold, licensed, or shared on other websites without obtaining consent from the author.
E N D
Presentation Transcript
METR/ENVS 113 METR/ENVS 113 Lecture 8: Ground-level Ozone SJSU Spring Semester 2020 Module 3: Outdoor Air Pollution (Ozone and PM2.5) Frank R. Freedman (Course Instructor)
Lecture 8: Ground Lecture 8: Ground- -Level Ozone (Outline) Level Ozone (Outline) Overview Health Effects Historical Perspective Ozone through the Atmosphere: Stratospheric vs. Ground-Level Ozone Formation Mechanism Ground-Level Ozone: A secondary pollutant Precursors: NOx and VOCs Photochemical Formation Reactions Regulatory Efforts and Emission Controls Briefly more on Practice Quiz 3 (Short Answer)
Ground-Level Ozone (Overview)
Ozone Ozone (O (O3 3): Adverse Health Effects from Inhalation ): Adverse Health Effects from Inhalation Key Points: Health Effects of Ozone Inhalation A lung irritant, inflames lung airway passages. Air becomes trapped in alveoli. Mainly short-term, episodic, acute effects. Shortness of breath, asthma exacerbation, increases susceptibility to respiratory illness. See next slide Normal lung airway Inflamed lung airway due to ozone exposure https://www.epa.gov/ground-level-ozone-pollution/health-effects-ozone-pollution https://www.epa.gov/ozone-pollution-and-your-patients-health/health-effects-ozone-general-population
https://www.epa.gov/ozone-pollution-and-your-patients-health/health-effects-ozone-general-populationhttps://www.epa.gov/ozone-pollution-and-your-patients-health/health-effects-ozone-general-population
Historical Perspective: Los Angeles (1950s, 1960s) CARB Formed (California agency) US EPA Clean Air Act (1970) 1-hr ozone = 680 ppb in 1955 Highest ever recorded (Current standard = 90 ppb) Hollywood Citizens News Collection, Los Angeles Public Library
Recall from Lecture 5 Ambient Air Quality Standards California** Federal* Ozone 1-hour average 8-hour average CO 1-hour average 8-hour average NO2 1-hour average annual average SO2 1-hour average 24-hour average 90 ppbv 70 ppbv -- 70 ppbv 20 ppmv 9.0 ppmv 9.0 ppmv 35 ppmv 180 ppbv 100 ppbv 30 ppbv 53 ppbv 250 ppbv 75 ppbv 40 ppbv 140 ppbv * Federal standards are set by Environmental Protection Agency (EPA) as NAAQS (National Ambient Air Quality Standards). ** California standards are set by the California Air Resources Board.
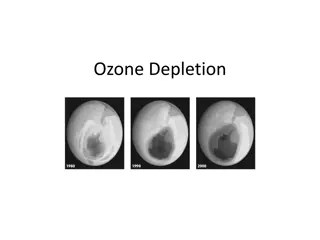
Ozone (O Ozone (O3 3) Concentration vs. Height (Troposphere & Stratosphere) ) Concentration vs. Height (Troposphere & Stratosphere) Stratospheric Ozone ( good ozone ) Where ultraviolet sunlight is absorbed. Beneficial effect to surface life. See Lecture 2 Ground-Level Ozone ( bad ozone ) Forms in urban areas, typically summertime A secondary pollutant not emitted, but formed in the atmosphere due to chemical reactions involving sunlight ( photochemical reactions ) Also called photochemical smog Ozone emission precursors: NOx and VOCs
Ozone Air Pollution: Summary Ozone Air Pollution: Summary Primary Pollutant: Emitted from a source Secondary Pollutant: Formed from chemical reactions in atmosphere Ozone is a secondary pollutant. Formed from chemical reactions between NOx and VOCs, which are emitted. Chemical reactions to form ozone require sunlight i.e. the reactions are photochemical reactions Hence, the term photochemical smog is synonymous. Nox and VOCs are called ozone precursors
Ground-Level Ozone (Formation Mechanism)
Chemical Reactions: Tropospheric Ozone Chemical Reactions: Tropospheric Ozone 2NO + O2 2NO2 Formation of NO2 Dissociation of NO2 to free oxygen through absorbing sunlight NO2+ sunlight NO + O O2+ O O3 Creates ozone NO + O3 NO2 + O2 Destroys ozone Equilibrium btw creation and destruction of ozone Roughly constant background tropospheric ozone concentrations from 10 40 ppb. Lower at night since sunlight goes away to create free oxygen.
Chemical Reactions: Ground Chemical Reactions: Ground- -Level Ozone Level Ozone 2NO + O2 2NO2 NO + VOC NO2 (complicated set of reactions btw NO & VOCs. Result is to create additional NO2) Formation of NO2 Dissociation of NO2 to free oxygen through absorbing sunlight NO2+ sunlight NO + O O2+ O O3 Creates ozone Destroys ozone NO + O3 NO2 + O2 Equilibrium btw creation and destruction of ozone More NO2 to create free oxygen due to urban emissions of extra NOX and VOCs. Ground-level ozone concentrations in urban air is higher can reach ~ 100 ppb or higher.
Ground-Level Ozone Formation: Conditions for Bad Episodes 1. Sunlight & Warm Temperatures 2. High Precursor Emissions (NOx and VOCs) 3. Unfavorable geography and meteorology Result: High Ozone (O3) & Photochemical Smog
Photochemical Urban Smog Photochemical Urban Smog (Pictorial summary highlighting emission sources & chemical reactions) Basic Chemical Reaction Hydrocarbons (VOCs) + NOx + sunlight photochemical smog (ground-level ozone, O3) Sunlight Emissions Chemical and photochemical reactions Reactive s Precursor NOx & VOC emissions
Ground Ground- -Levels Ozone Formation: Typical Diurnal Cycles Levels Ozone Formation: Typical Diurnal Cycles Diurnal variation of emissions of NO & VOC (cars & industry) + Diurnal variation of sunlight Emissions of NO and VOCs highest in morning Chemical reactions more active as day proceeds (more sunlight and higher temperatures) Ozone highest in mid-late afternoon NO + VOC NO2 O3 Conc sunrise sunset time
Case Study: Los Angeles (Summertime ground-level ozone) (non-attainment area for O3)
NOx emissions highest in LA City Center (western LA Basin) (Emissions spread across basin, but centered on major roadways since NOx is dominated by motor vehicle emissions)
VOC emissions highest in LA City Center (western LA Basin) (A bit more uniform across basin compared to NOx sources more varied, less centered on motor vehicles)
Typical Summertime Daytime Wind Pattern (Los Angeles area) High mountains bounding LA Basin to north and east Pollution blows inland and is bounded atop by subsidence inversion layer & on sides by topography
Ground-Level Ozone: Air Pollution Episodes in Los Angeles Basin (peak 1-hour concentrations for two example days ) 60 ppb 60 - 125 ppb > 125 ppb
Ground Ground- -Levels Ozone Formation: Typical Diurnal Cycles Levels Ozone Formation: Typical Diurnal Cycles NO + VOCNO2O3 Peak ozone in late afternoon Conc Low ozone at night sunrise sunset time Western LA Basin (where emissions of NO & VOC are highest) Eastern LA Basin (sea breeze winds blow precursor NO & VOC inland) (chemical reactions occur during travel form NO2 then O3) (O3 highest inland eastern LA Basin)
Ground-Level Ozone (Regulatory Efforts & Emission Controls)
Number of Days per Year Exceeding 8-hour ozone standard (Year 2015; Federal and State 8-hour ozone standard = 70 ppb) Figure 2-4 of http://www.aqmd.gov/home/air-quality/clean-air-plans/air-quality-mgt-plan/final-2016-aqmp
Implementation Plan (South Coast Air Quality Management District, SCAQMD) (http://www.aqmd.gov/home/air-quality/clean-air-plans/air-quality-mgt-plan/final-2016-aqmp) State Implementation Plans (SIP) are required from all air districts that are non-attainment areas for a particular criterial air pollutant and averaging time. The South Coast Air Basin is non-attainment with respect to both 1-hour and 8-hr ozone. SCAQMD therefore is required to submit a SIP for ozone.


")


")