Global Incidents of Corruption: A New Index by Davide Furceri
Davide Furceri from the International Monetary Fund discusses the need for a new index of corruption, construction methodology, impact on the economy, and progress in measuring corruption. The presentation emphasizes the IMF's active role in combating corruption worldwide.
Download Presentation

Please find below an Image/Link to download the presentation.
The content on the website is provided AS IS for your information and personal use only. It may not be sold, licensed, or shared on other websites without obtaining consent from the author.If you encounter any issues during the download, it is possible that the publisher has removed the file from their server.
You are allowed to download the files provided on this website for personal or commercial use, subject to the condition that they are used lawfully. All files are the property of their respective owners.
The content on the website is provided AS IS for your information and personal use only. It may not be sold, licensed, or shared on other websites without obtaining consent from the author.
E N D
Presentation Transcript
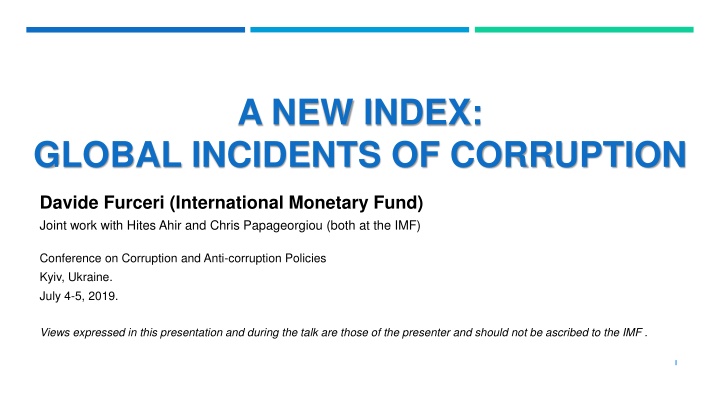
A NEW INDEX: GLOBAL INCIDENTS OF CORRUPTION Davide Furceri (International Monetary Fund) Joint work with Hites Ahir and Chris Papageorgiou (both at the IMF) Conference on Corruption and Anti-corruption Policies Kyiv, Ukraine. July 4-5, 2019. Views expressed in this presentation and during the talk are those of the presenter and should not be ascribed to the IMF . 1
ROADMAP Why do we need another index of corruption? I. How do we construct the new index of corruption CIGI? II. III. Stylized facts IV. Reliability checks V. Effect on the economy VI. What s next? 2
CONTINUED INTEREST FROM POLICYMAKERS AROUND THE WORLD IN COMBATING CORRUPTION. Substantially reduce corruption and bribery in all their forms Target 16.5 of SDGs. From Goal 16 of Sustainable Development Goals (SDGs). Goal 16 is dedicated to promote peace, justice and strong institutions. there is a growing consensus among our members that corruption is a macro-critical issue in many countries. From a speech by Christine Lagarde IMF s Managing Director on Addressing Corruption with Clarity, September 2017. 3
THE IMF IS ACTIVELY TACKLING THE ISSUE OF CORRUPTION IN ITS DAY-TO-DAY WORK. 4
THERE HAS ALSO BEEN SUBSTANTIAL PROGRESS IN MEASURING CORRUPTION. Corruption can and is being measured through a wide variety of innovative approaches. Given the imperfections of any individual approach, it is appropriate to rely on a wide variety of different indicators, both subjective and objective, individual as well as aggregate, cross-country as well as country-specific. Kaufman, Kraay and Mastruzzi (2007). There are three types of corruption measures available: Perceptions based: examples include: Corruption Perception Index (Transparency International) and Control of Corruption (World Bank). I. Victimization surveys based: examples include: Global Corruption Barometer (Transparency International) and Enterprise survey (World Bank). II. III. Big data and text mining based: examples include: News-Flow Index of Corruption, IPaidBribe.com, and procurement analysis. 5
HOWEVER, THE EXISTING MEASURES HAVE LIMITATIONS. Indicator Geographical coverage Global Time span How is the index constructed? Corruption Perception Index (CPI) Transparency International Worldwide Governance Indicators World Bank International Country Risk Guide News-Flow Indices of Corruption Yearly since 2012 . The index relies on surveys, and indicators from other sources. Global Yearly since 1996. The index relies on surveys, and indicators from other sources. Experts opinion. Global Monthly since 1984. 1995-2017. 30 countries It relies on big data (Factiva news) to search for news flow about corruption. 6
OUR CONTRIBUTION WHAT? A quarterly index of corruption Global Incidents of Corruption Index (GICI) for 143 countries from 1996 onward (updated every quarter). HOW? The Global Incidents of Corruption Index (GICI) is computed by counting the frequency of the word corrupt and its variant in the country reports of the Economist Intelligence Unit. The GICI index is then normalized by total number of words in the report. A higher number means higher corruption and vice versa. The index captures major corruption scandals/events, and discussion about corruption. 7
THE EIU COUNTRY REPORTS. The country reports covers politics, economic policy, the domestic economy, foreign and trade payments events, and on their overall impact on the country risk and outlook. EIU relies on a comprehensive network of experts that are based in the field, and country experts that are based at the headquarter. Five-step process to ensure accuracy and consistency across countries: writing the report, editing, second check, sub-editing, and production. 8
EXAMPLES OF HOW THE COUNTRY REPORTS OF THE ECONOMIST INTELLIGENCE UNIT LOOK LIKE. 9
A SAMPLE OF EXTRACTS THAT MENTIONS CORRUPTION IN THE REPORT. Mexico: The president, Enrique Pe a Nieto of the Partido Revolucionario Institucional (PRI), will focus the second half of his six-year term (which ends in 2018) on ensuring the successful implementation of the structural reforms that were passed in 2013-14. He must do this while confronting the fallout from numerous corruption and crime-related, involving both himself and his party. Kyrgyz Republic: Temir Sariev resigned from the premiership in April, sparked by allegations of his involvement in corrupt practices. Sooronbai Zheenbekov (SDPK) was swiftly appointed as his successor, boding well for policy continuity. 10
GICI VS. EXISTING MEASURES. Advantages: (i) the index capture actual scandals/events and discussion related to corruption, (ii) the index is available at a higher frequency, (iii) the index is updated on a more timely basis. Disadvantages: (i) only one source not a huge amount of text, (ii) captures (macro-relevant) incidents. 11
CORRUPTION HIGHER IN LOW-INCOME ECONOMIES THAN IN EMERGING AND ADVANCED ECONOMIES. Average GICI index by income group 13
HIGHER IN AFRICA, BUT THERE IS SIGNIFICANT HETEROGENEITY WITHIN EACH REGION. Average GICI index by region 14
INCIDENTS HAVE BECOME MORE FREQUENT IN RECENT YEARS. Global GICI index over time 3 quarter weighted moving average 0.14 Corruption scandals in Nepal, Tunisia, Rwanda, Mexico, and Tajikistan. Corruption scandals in Mozambique, Benin, Kenya, and Tajikistan. Corruption scandals in Gambia, Benin, Namibia, Togo, and Chile. Corruption scandals in Ghana, Tanzania, Chad, Sierra Leone, and Greece. 0.12 Corruption scandals in Cameroon, Vietnam, Gambia, Romania, and Malawi. 0.10 0.08 0.06 Corruption scandals in El Salvador, Madagascar, Argentina, Nigeria, and Guatemala. 0.04 historical average: 1996Q1 to 2018Q4 0.02 0.00 15 1996q1 1996q3 1997q1 1997q3 1998q1 1998q3 1999q1 1999q3 2000q1 2000q3 2001q1 2001q3 2002q1 2002q3 2003q1 2003q3 2004q1 2004q3 2005q1 2005q3 2006q1 2006q3 2007q1 2007q3 2008q1 2008q3 2009q1 2009q3 2010q1 2010q3 2011q1 2011q3 2012q1 2012q3 2013q1 2013q3 2014q1 2014q3 2015q1 2015q3 2016q1 2016q3 2017q1 2017q3 2018q1 2018q3
SPECIALLY IN EMERGING ECONOMIES. Advanced economies Emerging economies Low-income economies 0.3 0.25 0.25 historical average: 1996Q1 to 2018Q4 0.2 0.20 0.20 historical average: 1996Q1 to 2018Q4 0.2 0.15 0.15 0.1 0.10 0.10 historical average: 1996Q1 to 2018Q4 0.1 0.05 0.05 0.0 0.00 0.00 2001q2 2004q4 2013q3 1999q3 2001q2 2013q3 2015q2 1999q3 2001q2 2013q3 2015q2 1996q1 1997q4 1999q3 2003q1 2006q3 2008q2 2010q1 2011q4 2015q2 2017q1 2018q4 1996q1 1997q4 2003q1 2004q4 2006q3 2008q2 2010q1 2011q4 2017q1 2018q4 1996q1 1997q4 2003q1 2004q4 2006q3 2008q2 2010q1 2011q4 2017q1 2018q4 16
RELIABILITY CHECKS AND COMPARISON WITH EXISTING MEASURES 17
DIFFERENT VERSIONS OF GICI Brazil Niger India Vietnam 3.50 3.50 3.50 3.50 Version 1 Version 2 Version 3 Version 1 Version 2 Version 3 Version 1 Version 2 Version 3 Version 1 Version 2 Version 3 3.00 3.00 3.00 3.00 2.50 2.50 2.50 2.50 2.00 2.00 2.00 2.00 1.50 1.50 1.50 1.50 1.00 1.00 1.00 1.00 0.50 0.50 0.50 0.50 0.00 0.00 0.00 0.00 Q1- 1996 Q3- 2001 Q1- 2007 Q3- 2012 Q1- 2018 Q1- 1996 Q3- 2001 Q1- 2007 Q3- 2012 Q1- 2018 Q1- 1996 Q3- 2001 Q1- 2007 Q3- 2012 Q1- 2018 Q1- 1996 Q3- 2001 Q1- 2007 Q3- 2012 Q1- 2018 Note: The Global Incidents of Corruption Index (GICI) is computed by counting the frequency of corruption in EIU country reports. The GICI is then normalized by total number of words and rescaled by multiplying by 1,000. Version 1 include the following keywords: corrupt. Version 2 include the following keywords: corrupt, kleptoc, nepotism, graft Version 3 include the following keywords: corrupt, kleptoc, nepotism, rent-seeking, bribe, graft, extortion, crony, scam 18
HIGH CORRELATION WITH EXISTING MEASURES 7 1.2 140 100 International Country Risk Guide World Bank (1996-2016 average) 90 AFG SDN ZWE SDN UZB VEN Economist Intelligence Unit 6 120 Transparency International 1.0 IRQ COD LBY IRQ TKM UGA UKR NER YEM MMR LBN TCD GNB HTI IRN LBN MLIMRT TGO AGO CMR DOM SLV IND KWT LSO MYS NAM 80 ERI NGA AZE HTI BDI CAF CIV KHM KAZ MDG MEX NER PAN TUN COG ZWE ARM PRY GAB COD GIN NPL PAK RUS GMB MDA VEN KAZ MMR NIC TJK (1996-2016 average) TGO GNB UKR RUS (1996-2018 average) KEN IRQ TKM COD AFG LAO NGA PRY BGD ECU MDA MAR LKA TUR PNG PNG AGO KEN TZA VNM SDN HTI AGO TCD MMR (2012-17 average) KGZ MOZ UGA EGYDZA PAN ETH THA CHN 5 100 YEM PAK SDN VENAFG HTI IRQKAZ KGZ LAO LBY MMR COG RUSTJK TKM UKR AGO KHM HND IDN MNG PER ZMB LBY UZBTJK ZWE GNB CIVMLI BLR LBY AZE COL ZAF HND ALB ECU AZE GIN PNG KEN 70 GTM MWI SLE NGA BOL MOZ LVABGD BFA MEX JAM BGD HND LAO BDI PRY BGD YEM COG VEN KGZ AZE CAF SLE KHM CMR LBR NIC PAK TCD TGO MDA UZB IDN MWI YEM ARG SAU COGGIN IRN PAK PNG GIN MNG CMRTZA 0.8 SLE VNM GTM KEN GHA PHL ETH THA TGO RUS UKR KAZ ARG BLR EGY GRC ITA JOR SAU ARM BOL BIH BGRBFA HRV CZE GEO RWA SVN ESP SEN HRV DOM LTU TUR NGA GAB UGA LBR DZA CHN MKD GHA HUN KOR LVA LTU POL PRT QAT ARE USAURY ALB PHL BRA PER BGRROU IDN GMB COL TUN IND SLE ZWECHN HND CIV DOM CMR GAB BEN LBR QAT BEN BRA SEN PHL PRY MYS NIC SLV NAM MDANIC DOM ECUNER LBN IDN ITA OMN ARE ECU KWT MKD BDI SLV ZMB ZMBMWI ALB GTM ALB MRT NPL 60 JAM DZA ARM MLI LKASVKZAF MAR IRN CAF DZA BOL NPLETH THA TUR GTM UGA TZA PHL GMB ETH BOL MWI VNM BEN TZA BLR IRN EGY MOZ CZE TWN GRC CIV JAM 4 80 ZMB GAB PER BFA JOR CRI POL SVN KOR MEX IND MDG SLV CHNMNG ROU MKD BIH ERIARG NER PAN GMB BGR OMN LKA MAR COL THA PER ARM BRA IND MLI MRT MEX SAU LKA BIH LBN MNG LBR VNM PAN ISR BWA MDG COL MAR ARG EGY ROU GHA BFA BGR GEO SEN JAM MOZ HUN URY SVK 0.6 50 TUR TUN JOR RWABRA SAU IRL MYS SEN GEO HRV JORLSO JPN BLR MDG TUN LTU CRI LVA HKG ESP FRA GRC 3 60 ZAF MYS KWT ITA SVK LVA ERI ITA GHA USA BEL CHL PRT OMNHRV GRC POL OMN CZE NAM LTU 40 NAM ISR TWN POL HUN KOR KWT SVK BWA CHL FRA HKG NLD NOR SGP SWE SGP HUN KOR LSO RWA CZE ZAF GBR CRI QATTWN 0.4 AUS AUT QATTWN DEU CHE ISR ARE 30 ISRBWA SVN ARE 2 40 JPN URYCRI AUT IRL JPN GBR PRT URY ESP NLD CAN NOR BEL CAN FIN NZL SWE NZL FRA JPN SVN ESP 20 DEU CHE DNK USA BEL CHL PRTBWA AUS BEL CHL FRA 0.2 IRL FIN USA 1 20 AUT HKG correlation: 0.53 correlation: 0.50 correlation 0.54 correlation 0.44 DEU GBR DEU IRL 10 CAN AUS DNK HKG AUS GBR NOR CHE NLD FINAUT SWE SGP DNK FIN NZL NLD DNK CAN NZL SGP SWE CHE NOR 0 0.0 0 0 0.0 0.5 1.0 1.5 0.0 0.5 1.0 1.5 0.0 0.2 0.4 0.6 0.8 1.0 1.2 0.0 0.2 0.4 0.6 0.8 1.0 1.2 GICI Index (1996-2018 average) GICI Index (1996-2016 average) GICI Index (1996-2016 average) GICI Index (2012-17 average) 19
AS WELL AS RANK CORRELATIONS. Correlation between average GICI and other indexes Indicator Transparency International International Country Risk Guide (ICRG) (Corruption component) Pearson Spearman 0.4 0.5 0.4 0.5 Economist Intelligence Unit (EIU) (Corruption component) 0.5 0.6 World Bank (Corruption component) 0.5 0.6 20
THE GICI TRACKS WELL AND OFTEN ANTICIPATES CHANGES IN PERCEPTIONS BASED MEASURES. 21 Formal tests show that lagged value of CIGI are associated contemporaneous values of perception-based measures but not vice versa.
AND IT EXHIBITS MORE WITHIN-COUNTRY VARIATIONS THAN OTHER MEASURES. Comparing standard deviations: GICI Index vs. existing measures of corruption The high within-country variation of the indicator, allows the use of empirical analyses that can help to get closer to a causal interpretation of the effects of macroeconomic effects of corruption. 22
GICI IS CORRELATED WITH STRUCTURAL INDICATORS OF COMPETITION. 200 160 LBY YEM VEN COD COGHTI 180 BGD 140 GNB LBR AGO YEM MMR IRQ MOZ GAB LBR CMR MWI Global Competitiveness Index SDN MDG 160 COD VEN HTI DZAETH NGA BOL ZWE ZWE MDG MLI GMB BFA GIN Ease of doing business 120 GMB GIN ZMB TZA NGA MLI UGA CMR PAK NER LBN TZA TGOSEN 140 GHA PRY SLV PAK MOZ SEN ETH NIC LBN DOM IRN UGA MNG 100 (2018 ranking) EGY (2018 ranking) CIV ECU PHL BGD TUN ECU HND 120 EGY HND ARG ARGNIC PRY GHA KEN MDA NAM MWI NAMPNG BRA GRC DZA LKA GTM JOR DOM UKR 100 80 LKA BRA GTM URY KWT URY ALB HRV SAU PER ARM MAR JAM ZMB IRN SLV BWA ROU QAT JOR COL PAN ZAF 80 TUN OMN BWA OMN JAM IND ZAF 60 HUN MNG SVK IDN GRC PHL KAZ UKR VNM VNM PER LVA COL CRI KWT TUR MEX ALB BGR PAN KEN 60 MAR SVN CHL HRVBGR PRT ITACRI MEX ITA HUN ROU LTU 40 IND MDA ISR POL RUS CHN TUR BEL IDN AZE CHL ESP SVK ARM 40 CHE JPN SVN THA SAU CZE PRT NLD BLR CZE QATKOR CHN ESP RUS FRA POL IRL MYS AZE THAKAZ BEL AUS FRA AUT 20 CAN IRL DEU ISR AUT ARE 20 LVA NZL CAN TWN FIN AUS correlation: 0.39 correlation: 0.54 MYS FIN NOR DNK ARE SWELTU SWE GBR JPN NOR USA GBR NLD DEU HKG DNK HKG KOR 0.2 CHE USA SGP NZL SGP 0 0 CIV MMR LBY 0.2 BFA BOL GAB AGO 0.4 0.0 0.4 0.6 0.8 1.0 0.0 0.6 0.8 1.0 GICI Index (1996-2018 average) GICI Index (1996-2018 average) 23
AND SELECTED MACROECONOMIC INDICATORS. 6.0 70 70 GDP per capita, in log, 2018 correlation: 0.4 General government revenue correlation: -0.5 correlation: -0.6 60 60 5.0 GINI Index, 2010 estimate (% of GDP, 2018) 50 50 4.0 40 40 3.0 30 30 2.0 20 20 1.0 10 10 0.0 0 0 0.0 0.5 1.0 1.5 0.0 0.5 1.0 1.5 0.0 0.5 1.0 GICI Index (1996-2018 average) GICI Index (1996-2018 average) GICI Index (1996-2018 average) 24
THE EFFECT OF GICI ON OUTPUT. .01 0 -.01 -.02 0 5 10 15 step 90% CI Cumulative Orthogonalized IRF impulse : response Note: VAR fit to quarterly data for a panel of 46 countries from 1996q1 to 2018q4. Impulse responses of GDP to a one-standard deviation increase in the GICI based on a Cholesky decomposition with the following order: the log of average stock return, the GICI and GDP growth. The specification includes four lags of all variables. Country and time fixed effects are included. 26
THE EFFECT OF GICI ON OUTPUTROBUSTNESS CHECKS. 0.005 0.000 -0.005 -0.010 -0.015 baseline 8 lags GICI last -0.020 Controlling for stock market volatility Before GFC -0.025 0 1 2 3 4 5 6 7 8 9 10 11 12 13 14 15 Note: VAR fit to quarterly data for a panel of 46 countries from 1996q1 to 2018q4. Impulse responses of GDP to a one-standard deviation increase in the GICI based on a Cholesky decomposition with the following order: the log of average stock return, the GICI and GDP growth. The specification includes four lags of all variables. Country and time fixed effects are included. 27
COMPARING WITH OTHER MEASURES. World Bank Transparency International ICRG 28
NEXT STEPS 29
ONGOING WORK ON THE INDEX Extend the series back in time to the early 1950s. Classify types of corruption (public vs. private) and anti-corruption measures. Additional empirical analysis. 30
HISTORICAL GICI FOR NIGERIA: 1953 TO 2018 0.60 0.50 0.40 0.30 0.20 0.10 0.00 Q3-1953 Q3-1956 Q3-1959 Q3-1962 Q1-1967 Q1-1970 Q1-1973 Q1-1976 Q1-1979 Q1-1982 Q1-1985 Q3-1989 Q3-1992 Q3-1995 Q3-1998 Q3-2001 Q3-2004 Q1-2012 Q1-2015 Q1-2018 Q1-1952 Q1-1955 Q1-1958 Q1-1961 Q1-1964 Q3-1965 Q3-1968 Q3-1971 Q3-1974 Q3-1977 Q3-1980 Q3-1983 Q3-1986 Q1-1988 Q1-1991 Q1-1994 Q1-1997 Q1-2000 Q1-2003 Q1-2006 Q3-2007 Q1-2009 Q3-2010 Q3-2013 Q3-2016 31
CONCLUSION There is a continued interest from policymakers around the world in combating corruption. One of the areas in tackling corruption, involves measuring corruption. However, existing measures have some limitations. I. We construct a new index Global Incidents of Corruption Index (GICI) by counting the frequency of the word corrupt and its variant in country specific reports prepared by the Economist Intelligence Unit. The index performs well when comparing with existing measures. II. III. We believe that the GICI index helps validate perceptions and surveys based data. It is also important to rely on a range of measures to assess governance and recognizing no single measure is a perfect proxy for governance. 32
