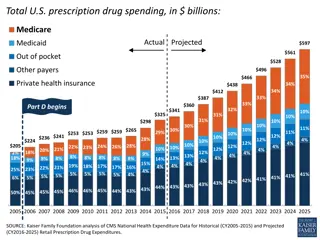
Future Health Spending Trends in Latin America
How much will it cost in 2050?
Future health spending in Brazil,
Chile and Mexico
Amanda Glassman and Juan Ignacio Zoloa
Inter-American Development Bank
June 14, 2013
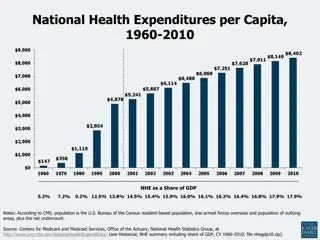
Public spending on social sectors including
health has increased…
•
In real terms, public
spending on health
increased 88% since
1995
•
Fastest growth:
–
DR (336%)
–
Venezuela (244%)
–
El Salvador (161%)
–
Chile (112%)
–
Brazil (98%)
–
Mexico (71%)
2
Source: Panorama Social 2013, ECLAC
Total public spending on social sectors, % GDP
57%
3
Source: IHME, 2013 (http://viz.healthmetricsandevaluation.org/gbd-compare/
As countries grow wealthier, they shift
towards public spending
4
Source: Hsiao 2005
Expectations are increasing over time…
5
Source: http://www.latinobarometro.org/latino/LATAnalizeQuestion.jsp
What can we expect in the future then?
•
Long-term fiscal projections and simulations
–
Identify factors that can be modified via public
policy
–
Allows for ex ante identification of inter-temporal
inconsistencies in needs and revenues
•
Illustrative analyses
–
Models that allow for modification of assumptions
6
Methods
•
Estimate probability of acquiring disease and seeking
care
•
Assume:
–
Current patterns of screening and treatment stay
constant (improbable)
–
Prices of services and medical technology in relation to
general price levels remain constant
•
Use annual projections of age structure, education,
labor market participation
•
Assign probabilities to individuals, assign expenditure
to each person
7
Levels of risk factors in Brazil, Mexico
and Chile, circa 2008
8
Projections of 10 conditions based on age
structure and risk factors, Brazil 2008-2050
9
Source: Own analysis based on PNAD 2008 and IBGE projections 2008.
Public spending projections associated with
hospitalization for 10 conditions, Brazil
10
Source: Own analysis based on PNAD 2008 and IBGE projections 2008.
Projections in public spending (% GDP),
under different policy scenarios, Brazil
11
Source: Own analysis based on PNAD 2008 and IBGE projections 2008.
Potential public policy levers and impact on
spending scenarios to 2050 (% GDP), Chile
12
Source: Own analysis based on ENS 2009 and INE projections.
Geographic distribution of variations in health
spending – 25% increase in smokers (trend)
13
Key messages
•
Even under conservative assumptions, public
spending on health will grow more rapidly in
the future, pushed by aging, risk factors and
technology.
•
Labor market participation and growth can
slow the spending trajectory, as can policy
measures related to risk factors.
•
Benefits and access expansion should be
accompanied by policies to maximize value for
money and contain current and future costs.
14
Conclusions
•
Only a few Latin American countries conduct
long-term fiscal projections in support of social
policy decisions, none as a matter of routine
–
Without LT projections, can’t understand implications
of policies and trends on public finances, can’t
manage expectations and can’t maximize welfare.
•
Possible to do but merit greater methodological
development, more and better data.
–
HH surveys on behavior, disease and utilization
–
Spending and cost by episode of illness
15
ANNEX
16
Metodología y datos: Salud (1)
1.
Identificar los factores históricos que
determinen el gasto publico en salud:
–
Demanda: demografía, epidemiologia, participación
laboral, niveles educativos, ingresos, factores de
riesgo (tabaco, sedentarismo, alcohol), lugar de
residencia, utilización de servicios de salud.
•
Proyecciones demográficas oficiales.
•
Encuestas de hogares con módulos sobre salud.
–
Oferta: niveles de detección y tratamiento, precios,
productividad, calidad de la oferta,
gasto.
•
Datos administrativos oficiales sobre el gasto en salud .
17
Metodología y datos: Salud (2)
2.
Simular 2010-2050 en base a la historia:
–
Cambios en la estructura etaria, consistentes con
estimaciones oficiales.
–
Probabilidad de contraer enfermedad utilizando
modelo probit tomando como variables explicativas
edad, genero, nivel educativo, etnia, factores de
riesgo y otras características socioeconómicas.
–
Asumiendo que las relaciones entre las variables
explicativas y las enfermedades se mantienen
constantes
18
The content explores the increasing public spending on social sectors, particularly health, in countries like Brazil, Chile, and Mexico. It discusses the growth in health expenditure since 1995 and predicts future trends in health spending based on economic development. The analysis highlights the importance of long-term fiscal projections and simulations to address evolving healthcare needs effectively.

Download Presentation

Please find below an Image/Link to download the presentation.
The content on the website is provided AS IS for your information and personal use only. It may not be sold, licensed, or shared on other websites without obtaining consent from the author.If you encounter any issues during the download, it is possible that the publisher has removed the file from their server.
You are allowed to download the files provided on this website for personal or commercial use, subject to the condition that they are used lawfully. All files are the property of their respective owners.
The content on the website is provided AS IS for your information and personal use only. It may not be sold, licensed, or shared on other websites without obtaining consent from the author.
E N D
Presentation Transcript
How much will it cost in 2050? Future health spending in Brazil, Chile and Mexico Amanda Glassman and Juan Ignacio Zoloa Inter-American Development Bank June 14, 2013
Public spending on social sectors including health has increased Total public spending on social sectors, % GDP In real terms, public spending on health increased 88% since 1995 Fastest growth: DR (336%) Venezuela (244%) El Salvador (161%) Chile (112%) Brazil (98%) Mexico (71%) 20 57% 18 16 14 12 10 8 6 4 2 0 1990-91 1992-93 1994-95 1996-97 1998-99 2000-01 2002-03 2004-05 2006-07 2008-09 2 Source: Panorama Social 2013, ECLAC
Source: IHME, 2013 (http://viz.healthmetricsandevaluation.org/gbd-compare/ 3
As countries grow wealthier, they shift towards public spending 100% 90% 80% 70% 60% Out-of-Pocket 50% Private Insurance 40% Other Pri. 30% Social Insurance 20% General Revenue 10% 0% Kenya Philippines Peru Bolivia Mali Cambodia China Nigeria Indonesia India Thailand Uganda Guatemala Colombia Zambia Vietnam Malaysia Nicaraugua Ecuador Costa Rica Tanzania Malawi Mozambique El Salvador -10% Source: Hsiao 2005 4
Expectations are increasing over time Source: http://www.latinobarometro.org/latino/LATAnalizeQuestion.jsp 5
What can we expect in the future then? Long-term fiscal projections and simulations Identify factors that can be modified via public policy Allows for ex ante identification of inter-temporal inconsistencies in needs and revenues Illustrative analyses Models that allow for modification of assumptions 6
Methods Estimate probability of acquiring disease and seeking care Assume: Current patterns of screening and treatment stay constant (improbable) Prices of services and medical technology in relation to general price levels remain constant Use annual projections of age structure, education, labor market participation Assign probabilities to individuals, assign expenditure to each person 7
Projections of 10 conditions based on age structure and risk factors, Brazil 2008-2050 125 100 Millones de enfermos 75 50 25 0 2008 2012 2016 2020 2024 2028 2032 2036 2040 2044 2048 Cirrosis Depresi n Hipertensi n Asma Tuberculosis Enfermedades renales Diabetes C ncer Enfermedades del coraz n Reuma Source: Own analysis based on PNAD 2008 and IBGE projections 2008. 9
Public spending projections associated with hospitalization for 10 conditions, Brazil 50000 45000 40000 35000 Millones de reales 30000 25000 20000 15000 10000 5000 0 2008 2012 2016 2020 2024 Tuberculosis Enfermedades renales Diabetes 2028 2032 2036 2040 2044 2048 Cirrosis Depresion Hipertension Asma Cancer Enfermedades del coraz n Reuma Source: Own analysis based on PNAD 2008 and IBGE projections 2008. 10
Projections in public spending (% GDP), under different policy scenarios, Brazil 18% 16% 14% 12% 10% 8% 6% 2008 2012 2016 2020 2024 2028 2032 2036 2040 2044 2048 Gasto en salud Con crecimiento tecnol gico restringido Con crecimiento tecnol gico hist rico Source: Own analysis based on PNAD 2008 and IBGE projections 2008. 11
Potential public policy levers and impact on spending scenarios to 2050 (% GDP), Chile Tratamiento universal Tecnol gico restringido (PIB FMI) Proyeccion es de 2050 Tecnol gico hist rico (PIB FMI) Crecimiento tecnol gico restringido Crecimiento tecnol gico hist rico A o Base 0% 5% 10% 15% 20% 25% Source: Own analysis based on ENS 2009 and INE projections. 12
Geographic distribution of variations in health spending 25% increase in smokers (trend) Cambios porcentuales en el gasto en salud Brasil, 2008 Rango nd 1.68 - 1.90 2.13 - 2.36 2.59 - 2.82 < 1.68 1.90 - 2.13 2.36 - 2.59 > 2.82 Fuente: Elaboraci n propia en Base a PNAD 2008 y Proyecciones IBGE 2008. 13
Key messages Even under conservative assumptions, public spending on health will grow more rapidly in the future, pushed by aging, risk factors and technology. Labor market participation and growth can slow the spending trajectory, as can policy measures related to risk factors. Benefits and access expansion should be accompanied by policies to maximize value for money and contain current and future costs. 14
Conclusions Only a few Latin American countries conduct long-term fiscal projections in support of social policy decisions, none as a matter of routine Without LT projections, can t understand implications of policies and trends on public finances, can t manage expectations and can t maximize welfare. Possible to do but merit greater methodological development, more and better data. HH surveys on behavior, disease and utilization Spending and cost by episode of illness 15
ANNEX 16
Metodologa y datos: Salud (1) 1. Identificar determinen el gasto publico en salud: Demanda: demograf a, epidemiologia, participaci n laboral, niveles educativos, ingresos, factores de riesgo (tabaco, sedentarismo, alcohol), lugar de residencia, utilizaci n de servicios de salud. Proyecciones demogr ficas oficiales. Encuestas de hogares con m dulos sobre salud. Oferta: niveles de detecci n y tratamiento, precios, productividad, calidad de la oferta, gasto. Datos administrativos oficiales sobre el gasto en salud . los factores hist ricos que 17
Metodologa y datos: Salud (2) 2. Simular 2010-2050 en base a la historia: Cambios en la estructura etaria, consistentes con estimaciones oficiales. Probabilidad de contraer enfermedad utilizando modelo probit tomando como variables explicativas edad, genero, nivel educativo, etnia, factores de riesgo y otras caracter sticas socioecon micas. Asumiendo que las relaciones entre las variables explicativas y las enfermedades se mantienen constantes 18


,")


")
")