Funnel Plots in Meta-analysis with Metafor in R
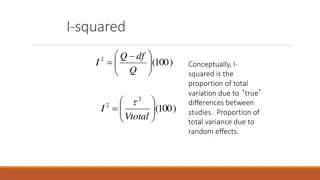
Funnel plots in meta-analysis help assess distribution symmetry, heterogeneity, and publication bias. The trim and fill analysis with Metafor in R examines data transformations, imputes missing values, and performs sensitivity analysis through re-computing funnel plots.

Download Presentation

Please find below an Image/Link to download the presentation.
The content on the website is provided AS IS for your information and personal use only. It may not be sold, licensed, or shared on other websites without obtaining consent from the author.If you encounter any issues during the download, it is possible that the publisher has removed the file from their server.
You are allowed to download the files provided on this website for personal or commercial use, subject to the condition that they are used lawfully. All files are the property of their respective owners.
The content on the website is provided AS IS for your information and personal use only. It may not be sold, licensed, or shared on other websites without obtaining consent from the author.
E N D
Presentation Transcript
Meta-analysis in R with Metafor 11: Funnel Plots Ordinary funnel, trim & fill
Funnel Plots Plot of effect size by standard error or sample size. Flows from sampling distribution. Typically used to assess distribution symmetry and heterogeneity by inspection. Also used to infer availability or publication bias; trim & fill is a kind of sensitivity ( what if ) analysis The funnel command examine your data know your data transformations and standard errors The trim-and-fill analysis with the funnel command impute missing values, re-compute funnel plot
R Code McDaniel data in z Plain funnel Trim & Fill results Trim & Fill funnel McDaniel data in r Plain funnel Trim & Fill results Trim & Fill funnel
Side by Side Funnels Without Trim and Fill Z r 0.000 0.000 0.144 0.071 Standard Error Standard Error 0.289 0.142 0.433 0.213 0.577 0.284 -1.00 0.00 1.00 2.00 3.00 -0.50 0.00 0.50 1.00 Fisher's z Transformed Correlation Coefficient Correlation Coefficient