Funding and Financial Performance in Wallonia's Waste Water Treatment Sector
In Wallonia, the waste water treatment sector is primarily funded and coordinated by SPGE, which delegates implementation to inter-municipalities. With significant investments over the years, SPGE maintains a balanced financial position and closely aligns revenues with expenditure levels. The sector aims for infrastructure improvements to meet sanitation targets set by the EU, focusing on achieving efficient wastewater treatment while managing operational costs effectively.
Download Presentation

Please find below an Image/Link to download the presentation.
The content on the website is provided AS IS for your information and personal use only. It may not be sold, licensed, or shared on other websites without obtaining consent from the author.If you encounter any issues during the download, it is possible that the publisher has removed the file from their server.
You are allowed to download the files provided on this website for personal or commercial use, subject to the condition that they are used lawfully. All files are the property of their respective owners.
The content on the website is provided AS IS for your information and personal use only. It may not be sold, licensed, or shared on other websites without obtaining consent from the author.
E N D
Presentation Transcript
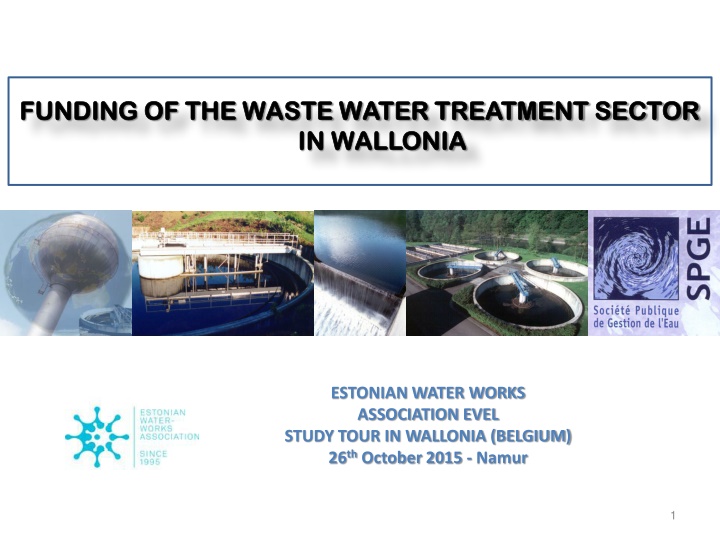
FUNDING OF THE WASTE WATER TREATMENT SECTOR FUNDING OF THE WASTE WATER TREATMENT SECTOR IN WALLONIA IN WALLONIA ESTONIAN WATER WORKS ASSOCIATION EVEL STUDY TOUR IN WALLONIA (BELGIUM) 26th October 2015 - Namur 1
A. A. SPGE IN THE CONTEXT OF THE WALLOON WATER SPGE IN THE CONTEXT OF THE WALLOON WATER SECTOR SECTOR 2
1. The water cycle : key players Storage Treatment 1. Extraction Municipalities Protection of wells Municipalities Municipalities 2. Supply Municipalities 3. Public Waste water collection and treatment Sewers Sanitation Collectors Environment 3
2. The waste water sector Choice of Public structure : Waste water policy is financed and coordinated by SPGE which in turn delegates to 7 WWT Inter- municipalities the implementation and operation of the infrastructures Has invested more than 3 billion in 14 years 7 approved Waste Water Treatment Inter-municipalities 4
B. B. FINANCIAL POSITION AND PERFORMANCE FINANCIAL POSITION AND PERFORMANCE 5
1. SPGE management general principles Determined by SPGE and approved by Walloon Government Walloon Region Capex Water tariff Debt level Own capital Operating costs Water fees Investments 1.4 billion Debt stock cover 0.17 billion fund 0.26 billion 3.4 billion Debt service 1.8 billion 0.06 billion As SPGE is designed to achieve a balanced position, its revenues are largely set in line with operating and capital expenditure levels and vice versa near-zero net profit approach 6
2. Capital Expenditure ( million) 300 250 200 150 100 50 0 2000 2001 2002 2003 2004 2005 2006 2007 2008 2009 2010 2011 2012 2013 2014 2015 2016 2017 2018 2019 2020 2021 2022 2023 2024 2025 2026 SPGE invested 3.2 billion between 2000 and SPGE plans to reduce its capex in the 2013 in improving its wastewater treatment coming years as a result of now infrastructure (coverage to most of the adequate compliance with sanitation Walloon population) targets set by the EU 7
3. Turnover : truth cost for wastewater treatment Customer profit Truth cost evolution : current value constant value Administrative simplification 3.00 Pooling of wastewater treatment costs amongst water users 2.50 2.00 Smoothing the overall increase in treatment costs over time 1.50 1.00 Outlook 0.50 Truth cost (in constant Euros) is expected to stabilize in the future. It is expected to increase at the same rate as the inflation rate (2020). 0.00 Co t-v rit ( courant) Co t-v rit ( constant 2001) 1,935 / m 1,935 / m Water control Committee Truth cost 2015 gives an advice on each increasing of truth cost approved by the Regional Minister of Economy 8
(3 bis. Reminder of the water pricing in Wallonia) Walloon Region average for pour 100 m (1/1/2015) Waste water Treatment Contract 20 Y PRODUCERS/ DISTRIBUTORS Edit consumers invoices Paid quarterly by producers Production 35 % Truth-cost for waste water treatment (SPGE) 1,9350 (40,8 %) Truth-cost for distribution 2,7839 (58,7 %) 60 % Supply 5 % Protection of wells Social Fund 0,0250 (0,5 %) 4,744 / m for 2015 + VAT of 6% 9
(3 ter. Water tariffand saving rate) File:Household saving rate (gross), 2012 (1) (%) YB14.png 10
4. Debt-to-Equity Ratio 3,000,000 Debt peak 1.9 bi. 2,500,000 2,000,000 (x 1.000 ) 1,500,000 Equity Debt 1,000,000 500,000 0 With capex reduction after 2015 and the anticipated increase in revenue, SPGE expects its net debt to peak 1.915 billion in 2017 The ratio debt to equity is expected to peak at 126% in 2014, below the maximum level of 130% specified in the management contract 11
5. Debt-to-EBITDA Ratio 14 12 10 8 Net debt to EBITDA 6 4 2 - After 2017, SPGE cash flow is sufficient to decrease debt level substantially 12
C. C. DEBT AND RISK MANAGEMENT DEBT AND RISK MANAGEMENT 13
1. Debt contex The Walloon Region does not bring its direct guarantee to the loans levied by the SPGE Constraints inherent to the stability pact The guaranteed outstanding debt is already high A. The Walloon Region authorizes irrevocably the SPGE to increase the water price to recover all its charges including financial charges (= informal guarantee Management contract) Walloon Region replace the failing producer after max. 40 days B. Insolvency of the co-contracting producers C. The Walloon Region appoints 10 of the 15 board members directly or indirectly via its holding company 14
http://accounts-of-society.eu/wp-content/uploads/2014/01/Eurostat_logo1.jpghttp://accounts-of-society.eu/wp-content/uploads/2014/01/Eurostat_logo1.jpg 1 bis. Debt contex (Eurostat classification ESA 2010) SPGE is not included in the consolidation perimeter of the Walloon Region debt SPGE (classification European System of Accounts = S11001) is an unit : (1) institutional autonomy (own goods, decision-making, keep a complete set of accounts) (2) public control (public ownership, appointment members board of Directors via WR, public control ) (3) market producer (non financial) (3a) sales to public sector < 50% truth-cost charged to households and corporate (3b) sales cover more than 50% of costs 15
2. Funding needs 250,000,000 200,000,000 Funding needs 2015 2016 2017 2018 171.3 M 150,000,000 New debt 186.6 M 219.6 M 100,000,000 Amortization 106.4 M 683.9 M 50,000,000 4 years 0 2015 2016 2017 2018 2019 2020 2021 2022 2023 - 50,000,000 As of October 2015, SPGE has financed more than 100% of its 171.3 million funding requirements for 2015 Since 2008 crisis, SPGE anticipates its funding needs from 6 to 9 months SPGE is covered until June 2016 Debt amortization profile remains smooth 16
3. Liquidity 210 million current short-term facilities 35 million in confirmed credit facility with Belfius Bank 100 million of CP program covered by back-up credit facilities 75 million in ST investments readily available (on a total of 160) Liquidity position is adequate and predectable New funding of 200 million signed with EIB EIB-logo loan already approved for a 25 years maturity could be used as credit facility during 2 years (CF of 10 bp) 17
EIB-logo 3 bis. Liquidity (European Investment Bank) Appropriate credit risk approach -First fundings by EIB in 2005 but first contacts in 2002 with an appropriate credit risk approach for a non sovereign as SPGE -For private investors, to be able to get fundings by EIB is like a rating Big fundings -Maximum of 50% of the Capex could be more than 50% of the debt because investments funded by own funds from the Walloon Region (= 1 billion Euros) could also be elegible by EIB Opportunity to use EIB funds as credit line facility with very low commitment fee 18
4. Debt structure and diversification EIB-logo EIB loans 43.8% 893.7 M Bank Loan Average interest rate 2.85% Bank loans & PP 32.6% 662.3 M Duration 7.4 years 1 year 149.7 M > 1 year 331.8 M CP Program Fixed rate 92.2% 23.6% 481.5 M Gross Debt 100.0% 2,037.5 M 234.0 M 137.9 M Cash invest. Cash invest. October 2015 1,899.6 M Net Debt 19
5. Rating Rating SPGE long term issuer A1 Rating SPGE short term issuer P1 Rating SPGE CP program P1 Outlook Stable Moody s Joint Default Analysis methodology for government related issuers focus on 2 inputs : A SPGE baseline credit assessment (BCA) of A3 High likelihood of support from the Walloon Region to prevent a default (SPGE s public shareholding, reputation risk of the WR, SPGE s strategic importance, the WR s commitment to support SPGE in case of liquidity shortage) 20
6. Attractiveness of SPGE for investors ? No formal guarantee from the sovereign but we concede truth cost mechanism or publicownership clauses we concede ratingloss clauses at Baaa (minus 4 grades) we have a proximity to the cash flow (truth cost paid by the consumer) Documentation we provide standard under Belgian, German or English law we provide own legal opinions we can ensure a listing of the issuing (Luxemburg, Frankfurt, ) Flexibility and proactivity Quick approval from the management (we can deal in a week) As we anticipate our funding needs, we are more flexible Spreads and maturity Our benchmark is Belgian obligations + about 45 bp and, with a duration of 7.7 years, we now favor more MT maturities (4-6 and 10- 15years) 21
