Foreign Exchange Rates: Factors, Equilibrium, and Impact
Explore the dynamics of foreign exchange rates, learning about factors influencing currency value, equilibrium points in supply and demand, and how changes affect exchange rates. Discover the intricacies of currency supply and demand, including imports, investments, speculation, and government interventions, in this comprehensive guide to understanding the complex world of foreign exchange.

Download Presentation

Please find below an Image/Link to download the presentation.
The content on the website is provided AS IS for your information and personal use only. It may not be sold, licensed, or shared on other websites without obtaining consent from the author.If you encounter any issues during the download, it is possible that the publisher has removed the file from their server.
You are allowed to download the files provided on this website for personal or commercial use, subject to the condition that they are used lawfully. All files are the property of their respective owners.
The content on the website is provided AS IS for your information and personal use only. It may not be sold, licensed, or shared on other websites without obtaining consent from the author.
E N D
Presentation Transcript
Foreign Exchange Rates Foreign Exchange Rates
Learning Objectives Learning Objectives After completing this assignment, students will: Understand factors that can affect the value of a currency s exchange rate
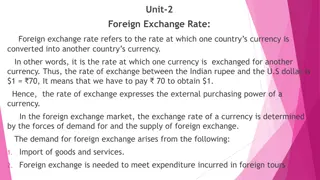
Foreign Exchange Rate Foreign Exchange Rate Currencies are continuously traded on foreign exchange markets; dealers adjust to changes in supply and demand, and the prices change accordingly. Foreign exchange rate: the price at which one currency can be converted into another currency.
Foreign Exchange Rate (cont.) Foreign Exchange Rate (cont.) For examples in this slide deck, we define the exchange rate as how many units of foreign currency you can get for 1 unit of the home currency (in this case, the US dollar). For example, on 12/4/2017 the US dollar to Indian rupee exchange rate was 64.42 rupees per dollar. A person could go to a bank and exchange 1 US dollar for 64.42 Indian rupees.
Supply and Demand Supply and Demand Using the supply and demand diagram, the demand curve (D) for US dollars intersects with the supply curve (S) of US dollars at the equilibrium point. The graph shows this equilibrium price at an exchange rate of 64.42 Indian rupees per dollar. Market for USD in India Exchange rate /$ S 64.42 /$ D Quantity
Supply and Demand (cont.) Supply and Demand (cont.) Exchange rate /$ Market for USD in India If the demand for US dollars increases from D1 to D2, the demand curve shifts outward. The new equilibrium point indicates the exchange rate has risen to 65 Indian rupees per dollar. S 65.00 /$ 64.42 /$ D2 D1 Quantity
Factors Affecting Currency Supply Factors Affecting Currency Supply Imports: domestic currency must be supplied and exchanged into the foreign currency to purchase the imported goods. Investment in foreign assets (e.g., purchasing bonds or real estate in a foreign country) Speculation by investors in the foreign exchange market Government intervention Travel for business/tourism to the foreign country
Factors Affecting Currency Demand Factors Affecting Currency Demand Exports: foreigners demand the domestic currency to make their purchases. Foreign investment in domestic assets Speculation by investors in the foreign exchange market Government intervention Foreigners visiting for business/tourism
Factors Affecting Currency Exchange Factors Affecting Currency Exchange Rates Rates Supply Demand Imports Exports Investing in foreign assets Foreign investment in domestic assets Speculation Speculation Government intervention Government intervention Travel abroad Travel from abroad Government debt Economic growth or recession Balance of trade & Terms of trade Commodity prices Political stability Interest rates Inflation rates
Changing Demand: Example Changing Demand: Example To return to the example of a shifting demand curve, one scenario resulting in increased demand for USD could be US interest rates rising. Indian investors may then demand more USD in order to purchase US bonds as investments. The /$ exchange rate would rise. Exchange rate /$ Market for USD in India S 65.00 /$ 64.42 /$ D2 D1 Quantity
Appreciation Appreciation Appreciation is an increase in the value of a country s currency with respect to another currency. For example, if the exchange rate starts at 100 Kenyan Shilling/USD and it rises to 105 Kenyan Shilling/USD, the dollar has experienced a 5% appreciation relative to the Kenyan Shilling.
Appreciation: Chart Example Appreciation: Chart Example In 2015, the US dollar appreciated 11.4% against the Euro. In this period, the US economy was strengthening, while Europe s economy was struggling. Europe began to lower interest rates as part of an economic stimulus program.
Depreciation Depreciation Depreciation is a decrease in the value of a country s currency with respect to another currency. For example, if the exchange rate starts at 100 Kenyan Shilling/USD and it falls to 95 Kenyan Shilling/USD, the dollar has experienced a 5% depreciation relative to the Kenyan Shilling.
Using Indexes Using Indexes Economists track overall appreciation or depreciation of the dollar using exchange rate indices comprised of a basket of several international currencies. For example the Federal Reserve s Major Currencies index is a weighted average of the foreign exchange values of the US dollar against a subset of currencies chosen because they circulate widely outside the country of issue.
Devaluation and Revaluation Devaluation and Revaluation Devaluation occurs when the government or central bank of a country controls the exchange rate and reduces the value of the domestic currency. (Whereas depreciation refers to a loss of value in the market when the exchange rate is floating). Conversely, revaluation is when the government or central bank of a country controls the exchange rate and increases the value of the domestic currency. (Whereas appreciation refers to a gain of value in the market when the exchange rate is floating).
Devaluation: Chart Example Devaluation: Chart Example August 11th, 2015, the People s Bank of China devalued the yuan (renminbi). As this exchange rate chart illustrates, on that day the US dollar appreciated in value close to 2% against the yuan.
Conclusion Conclusion Changes to supply/demand of a currency are affected by: Imports/exports Investment in foreign assets/foreign investors Speculation by investors in the foreign exchange market Government intervention Travel abroad/travel from abroad
Conclusion (cont.) Conclusion (cont.) Appreciation is when the value of a currency rises in relation to another currency (or index of currencies); depreciation is when the value of a currency falls in relation to another currency/index. Devaluation and revaluation are similar to depreciation and appreciation, but occur when a government or central bank actively adjusts the value of the currency.
Notes Notes When using the Foreign Exchange Rates Charts query, most charts illustrate how many units of foreign currency you can get for 1 US dollar. In the WRDS query form, if a country or index has an asterisk (*) this indicates the inverted format is also available. These charts illustrate how many units of the domestic currency (the US dollar) you can get for 1 unit of the foreign currency.


")

")


")