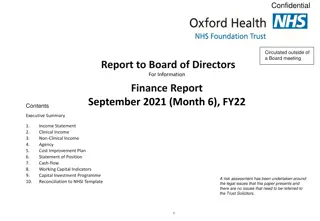
Financial Position Summary FY 2017
Total assets increased by $4.24 million, operating deficit of $339,300, net surplus for operations of $1.281 million. Detailed financial analysis and statement of cash flows for the fiscal year 2017.

Download Presentation

Please find below an Image/Link to download the presentation.
The content on the website is provided AS IS for your information and personal use only. It may not be sold, licensed, or shared on other websites without obtaining consent from the author.If you encounter any issues during the download, it is possible that the publisher has removed the file from their server.
You are allowed to download the files provided on this website for personal or commercial use, subject to the condition that they are used lawfully. All files are the property of their respective owners.
The content on the website is provided AS IS for your information and personal use only. It may not be sold, licensed, or shared on other websites without obtaining consent from the author.
E N D
Presentation Transcript
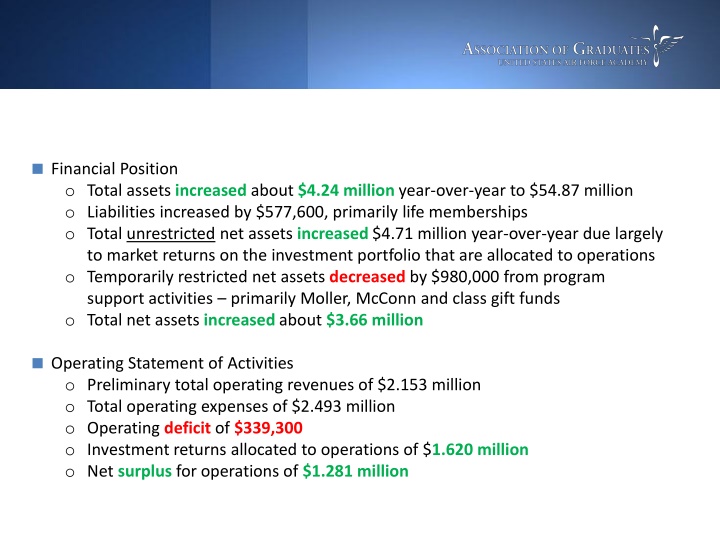
Financial Position o Total assets increased about $4.24 million year-over-year to $54.87 million o Liabilities increased by $577,600, primarily life memberships o Total unrestricted net assets increased $4.71 million year-over-year due largely to market returns on the investment portfolio that are allocated to operations o Temporarily restricted net assets decreased by $980,000 from program support activities primarily Moller, McConn and class gift funds o Total net assets increased about $3.66 million Operating Statement of Activities o Preliminary total operating revenues of $2.153 million o Total operating expenses of $2.493 million o Operating deficit of $339,300 o Investment returns allocated to operations of $1.620 million o Net surplus for operations of $1.281 million
Statement of Cash Flows o Net cash used in operating activities of $752,100 o Net cash provided by investing activities of $595,700 o Net cash provided by financing activities of $1.04 million o Net increase in cash and cash equivalents of $883,900 o Cash and cash equivalents at December 31, 2017 of $1.668 million Fixed Income Cash-basis Operating Statement of Activities o Cash-basis revenues of $2.554 million o Investment income distributions were $448,200 year-to-date o Subsidy receipts from USAFA Endowment of $332,300 o Total cash operating expenses of $2.298 million o Operating surplus of $256,200 o Capital purchases for operating purposes just over $13,800 o Cash-basis net surplus of approx. $242,400 for operations
Annual Time-Weighted Returns vs. Balanced Index As of 12/31/2017 30.00 22.95 19.75 19.27 20.00 16.02 22.93 17.85 10.94 16.88 8.11 10.00 12.62 4.61 10.10 6.15 (2.77) (2.40) 0.00 3.32 L/T Fund (3.12) (5.49) (10.00) Index (20.00) (30.99) (30.00) (34.27) (40.00) 2008 2009 2010 2011 2012 2013 2014 2015 2016 2017
Cumulative Time-Weighted Returns vs. Balanced Index As of 12/31/2017 25.00 19.27 20.00 16.88 15.00 13.55 10.22 9.76 L/T Fund 9.10 11.39 10.00 8.21 7.83 7.70 Index 9.04 6.58 9.22 8.34 7.62 4.32 7.27 6.59 5.00 6.09 4.27 0.00 Latest 1 Yr 4 Yrs 10 Yrs 9 Yrs 8 Yrs 7 Yrs 6 Yrs 5 Yrs 3 Yrs 2 Yrs
Total Assets FY 2012-2017 (in Thousands) $60,000 $55,660 $52,643 $52,283 $49,406 $50,000 $44,627 $39,903 $40,205 $40,000 $37,616 $36,389 $35,514 $28,149 $30,000 Investments Other Total $24,423 $20,000 $15,455 $14,667 $11,091 $8,240 $10,000 $9,503 $8,016 $0 2012 2013 2014 2015 2016 2017
Net Assets FY 2012-2017 (in Thousands) $30,000 $25,249 $25,000 $22,437 $20,262 $20,000 $15,752 $15,000 Unrestricted Temp Res Perm Res $12,247 $11,454 $11,410 $11,191 $13,218 $11,888 $10,000 $6,127 $4,256 $5,000 $4,285 $4,144 $3,957 $4,050 $4,024 $3,911 $0 2012 2013 2014 2015 2016 2017
Cash-basis Sales of Investments FY 2012-2017 (in Thousands) $1,200 $1,089 $1,000 $1,000 $924 $912 $845 $835 $762 $800 $764 $742 $600 $412 $448 Actual Budget $400 $415 $300 $200 $- $(30) $(200) 2012 2013 2014 2015 2016 2017 YTD
Cash-basis Subsidy from Endowment FY 2012-2017 (in Thousands) $1,200 $1,045 $1,000 $886 $782 $770 $800 $738 $670 $661 $769 $600 $680 $600 Actual Budget $600 $600 $426 $400 $332 $200 $- 2012 2013 2014 2015 2016 2017 YTD
Cash from Operations FY 2012-2017 (in Thousands) $3,500 $3,306 $3,300 $3,047 $3,100 $3,213 $2,897 $2,900 $2,688 $2,897 $2,700 $2,678 $2,497 $2,656 $2,500 $2,396 Actual Budget $2,300 $2,131 $2,252 $2,100 $1,900 $1,774 $1,700 $1,658 $1,500 2012 2013 2014 2015 2016 2017 YTD