Financial Impacts of Electric Vehicles on Utility Ratepayers and Shareholders
Analysis funded by the U.S. Department of Energy examines the effects of electric vehicle adoption on utility finances, including ratepayer and shareholder impacts. The study delves into customer EV adoption, utility revenue collection, and investment value. Various charging strategies and utility cost breakdowns are explored, highlighting the implications on sales, generation, and supply costs. The research aims to provide insights for policymakers and regulators in shaping the future energy landscape.
Download Presentation

Please find below an Image/Link to download the presentation.
The content on the website is provided AS IS for your information and personal use only. It may not be sold, licensed, or shared on other websites without obtaining consent from the author.If you encounter any issues during the download, it is possible that the publisher has removed the file from their server.
You are allowed to download the files provided on this website for personal or commercial use, subject to the condition that they are used lawfully. All files are the property of their respective owners.
The content on the website is provided AS IS for your information and personal use only. It may not be sold, licensed, or shared on other websites without obtaining consent from the author.
E N D
Presentation Transcript
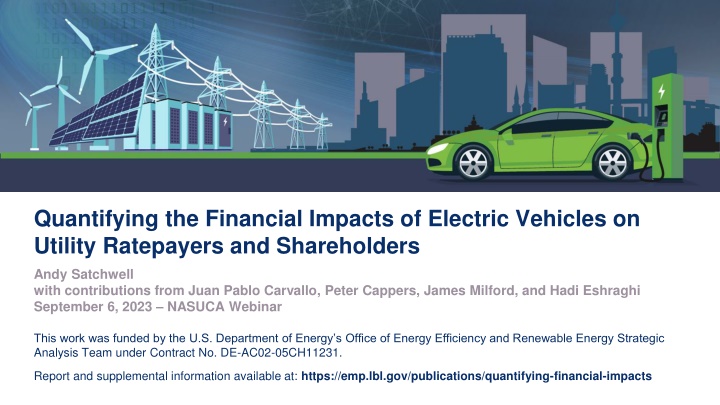
Quantifying the Financial Impacts of Electric Vehicles on Utility Ratepayers and Shareholders Andy Satchwell with contributions from Juan Pablo Carvallo, Peter Cappers, James Milford, and Hadi Eshraghi September 6, 2023 NASUCA Webinar This work was funded by the U.S. Department of Energy s Office of Energy Efficiency and Renewable Energy Strategic Analysis Team under Contract No. DE-AC02-05CH11231. Report and supplemental information available at: https://emp.lbl.gov/publications/quantifying-financial-impacts
Policy and regulatory context why does this matter? Including customer EV adoption and balance among customers with and without EVs Ratepayer Impacts Including how utility collects revenues and provides value to investors, as well as scope of utility roles and responsibilities Utility Shareholder Impacts 2
Bookend charging strategies used in this study are characterized by system peak impacts Low Peak Impact is the charging strategy that minimizes EV impacts on peak demand. High Peak Impact is the charging strategy that maximizes EV impacts on peak demand. The charging strategies adapt over time to achieve the performance objective. 3
Summer-peaking, vertically integrated utility characterization $6,000 30 Average retail rate (nominal cents/kWh) $5,000 25 Annual utility costs (nominal $M) Fuel and Purchased Power $4,000 20 O&M Tax $3,000 15 Debt Interest Depreciation $2,000 10 Return on Rate Base Equity Average All-In Rate ( /kWh) $1,000 5 $0 0 4
How do we represent EV impacts on utility sales? 16.0% High VMT (~14.0% increase 2040 retail sales) EV impact on retail electricity sales (% of annual utility retail sales) 14.0% 12.0% High EV penetration (~9.0% increase in 2040 retail sales) 10.0% 8.0% 6.0% 4.0% Low EV penetration (~1.5% increase in 2040 retail sales) 2.0% 0.0% 5
How do we characterize EV impacts on utility generation and supply costs? Generation capital, operations and maintenance (O&M), and FPP costs are modeled endogenously in FINDER using a built-in capacity expansion and dispatch logic. Hourly forecasts transformed into energy requirements by time period Utility hourly load adjusted for incremental EVs Contributions of variable renewable energy and hour-to- hour ramp rates determined Forward-looking capacity expansion that minimizes portfolio investment and operating costs Weekly and hourly generation dispatch that minimized operating costs 6
How do we characterize EV impacts on utility distribution and program costs? Distribution CapEx Costs EV Charging Infrastructure Costs EV Program Costs Expert-elicited probability of feeder upgrades and costs driven by EV impacts on coincident peak and non-coincident peak Regulatory filing data to inform ratepayer- funded EV program implementation and administrative costs, as well as caps on program size Regulatory filing data to inform ratepayer- funded EVSE and control costs, as well as caps on program size Exogenous characterization 7
Financial metrics Metric Representation Calculation Earnings Quantifies future utility earnings opportunities Revenues - Costs All-in Average Retail Rate Quantifies total rate impacts across all utility ratepayers Revenues / Sales Quantifies average incremental annual utility cost impact of integrating EVs (inclusive of utility generation, distribution, EV program, and charging control costs) Annual Cost per EV Costs / EVs All financial metrics are discounted over 20 years assuming a 7% nominal rate for utility earnings (representing average utility weighted average cost of capital) and a 5% nominal rate for average all-in retail rates and costs per EV. 8
ELECTRICITY MARKETS & POLICY What are the financial impacts of EVs under High Peak Impact charging? Comparison point: Utility without any incremental EV deployment 9
EVs generally increase shareholder earnings and retail rates remain roughly unchanged 5% 4.7% Change in financial metric compared to No EV (%) 4% 3% Avg retail rates (20-yr NPV) 2% 2.2% 1% Earnings (20-yr NPV) 0.5% 0% -0.1% -1% Low EV penetration High EV penetration High Peak Impact charging 10
Rate impacts are driven by timing of infrastructure investments and increase in sales 2.0% Change in 5-year average nominal retail rate compared to No EV (%) 1.6% 1.0% 1.2% 1.0% 0.3% 0.2% 0.5% 2025 0.0% -0.7% 2030 -1.0% 2035 -2.0% 2040 -2.9% -3.0% -4.0% Low EV penetration High EV penetration High Peak Impact charging 11
ELECTRICITY MARKETS & POLICY How does a Low Peak Impact charging strategy affect financial impacts, and how robust are results to different deployment assumptions? Comparison point: Utility with incremental EVs deployed with High Peak Impact charging 12
Low Peak Impact charging reduces rates and earnings Change in financial metric compared to 0.0% High Peak Impact charging (%) -0.5% -0.8% -1.0% -1.0% Avg retail rates (20-yr NPV) -1.5% -1.9% Earnings (20-yr NPV) -2.0% -2.4% -2.5% -3.0% High EV penetration Low EV penetration 13
Financial impacts of Low Peak Impact charging are directionally consistent across sensitivities 0.0% Change in financial metric compared to High Peak Impact charging (%) -0.5% -1.0% Sensitivity range -1.5% Low EV penetration -2.0% High EV penetration -2.5% -3.0% Avg retail rates (20-yr NPV) Earnings (20-yr NPV) 14
Managed charging strategies reduce the incremental annual cost of integrating EVs by ~38-62% $700 (20-yr discount-weighted) $600 $616 Annual $/EV $500 $471 $400 $300 $293 $200 $232 $100 $- High Peak Impact Low Peak Impact High Peak Impact Low Peak Impact High EV Penetration Low EV Penetration 15
Key findings and discussion Ratepayers are almost always better off and more so if EVs are deployed with managed charging strategies. Compared to a future without EVs, shareholder are also better off, but managed charging erodes some of the incremental earnings. A forward-looking and long-term perspective is necessary to make large initial utility infrastructure investments that enable greater EV deployment and result in later rate decreases. Impacts are overall quite small on a total utility basis; but, they could be more significant for particular customer classes depending on cost allocation and cost recovery, which were not explored in the study. To trigger managed behavior we model requires dynamic infrastructure planning process and/or flexible managed charging strategy to reflect how the utility load shape evolves inclusive EV load (e.g., EV TOU periods will change from overnight to middle-of-day as coincident peak EV load impacts build). 16
Future research opportunities Assume different EV penetration levels and adoption rates. Model medium-duty and heavy-duty EVs (MDVs and HDVs). Incorporate a more detailed distribution cost model. Explore additional charging strategies and profiles, utility characterizations, and customer-class impacts. Model EV-specific rate designs and quantify cost shifts between EV owners and non-EV owners. 17
ELECTRICITY MARKETS & POLICY Contacts Andrew Satchwell | ASatchwell@lbl.gov For more information Download publications from the Electricity Markets & Policy: https://emp.lbl.gov/publications Sign up for our email list: https://emp.lbl.gov/mailing-list Follow the Electricity Markets & Policy on Twitter: @BerkeleyLabEMP Acknowledgements This work was funded by the U.S. Department of Energy (DOE) Office of Energy Efficiency and Renewable Energy (EERE) Strategic Analysis Team (SA) under Contract No. DE-AC02-05CH11231. We would like to especially thank Ookie Ma and Kara Podkaminer (DOE) for their support of this work. For reviewing the study and providing valuable feedback, we thank Michelle Levinson (World Resources Institute), Galen Barbose (Berkeley Lab), and Kara Podkaminer, Noel Crisostomo, and Paul Spitsen (DOE). The views and opinions of authors expressed herein do not necessarily state or reflect those of the United States Government or any agency thereof, or The Regents of the University of California. 18
Berkeley Labs FINDER model The FINDER model is a pro- forma financial model of changes in utility costs and revenues with the addition of DERs. Model outputs include shareholder metrics (achieved return-on-equity (ROE) and earnings) and ratepayer metrics (average retail rates and bills). The FINDER model has been developed over more than 14 years and used to support foundational research and state technical assistance in seven states and two regions. For more information on the FINDER model and related publications, see: https://emp.lbl.gov/projects/finder-model 19
Distribution CapEx Problem: estimate physical and monetary distribution system expansion based on EV load Existing solutions are based on a simple $/EV value with very little empirical support Our solution: Leverage expert elicitation for cumulative probability of distribution system upgrades produced by CalETC Convolve with normal distribution for EV load distribution across feeder. Use CP load for substation and primary system, and NCP load for secondary system Determine the share of feeders requiring an upgrade Monetize based on CalETC s expert elicitation using high/low ranges given the uncertainty; scale up to the size of the representative utility 20
Utility EV charging infrastructure and program costs Scenario Element Low value Medium value High value Managed charging adder Accounting treatment $0 $0 $0 $0 N/A L1 charger cost ($/L1 charger) $1,529 $7,143 $15,829 $1,200 per residential charger and $2,200 per workplace charger Capitalize L2 charger cost ($/L2 charger) $38,320 $66,250 $149,753 $0 Capitalize DCFC charger cost ($/DCFC charger) $70,800 $619,500 $2,494,800 $0 Expense Annual program cost 1/3 total charger deployment 1/6 total charger deployment 1/12 total charger deployment N/A N/A Program cap 21
