Exploring Mathematics Through Real-World Scenarios
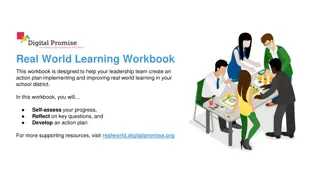
Engage students in interactive math lessons by incorporating real-world problems like amusement park costs, cross-country travel, and photo book comparisons. Encourage critical thinking and application of mathematical concepts through graphing, equations, and data analysis. Discover student perspectives, misconceptions, and growth throughout the learning process.
Download Presentation

Please find below an Image/Link to download the presentation.
The content on the website is provided AS IS for your information and personal use only. It may not be sold, licensed, or shared on other websites without obtaining consent from the author. Download presentation by click this link. If you encounter any issues during the download, it is possible that the publisher has removed the file from their server.
E N D
Presentation Transcript
SHARING SUCCESS We have asked you to try new things the past couple sessions. In September, we asked you to plan a unit or series of lessons based on a single problem (like Snakes) and in November we asked you to use technology in your classroom. We would like you to share out what you have tried and how it went.
BUILDING ON PRIOR KNOWLEDGE A unit focusing on CED.A.2 Create equations in two or more variables to represent relationships between quantities; graph equations on coordinate axes with labels and scales. Pre-Assessment THE AMUSEMENT PARK Entrance to an amusement park is $20 and games are $3 each. Write an equation that gives you the total cost of admission and games. Create a graph to represent this situation. What is the slope of the line? How does the slope compare to the unit price of a game (cost per game)? Justify your answer.
What prior knowledge would a student need to have to in order to successfully complete this problem? What misconceptions might this problem reveal about a student s thinking?
TRAVEL CROSS-COUNTRY Ben is spending his summer driving across the country. He is going to spend the first day just driving straight west. The table below shows the distance traveled as a function of time. a. Graph this relationship on a coordinate plane. TRAVEL CROSS-COUNTRY Ben is spending his summer driving across the country. He is going to spend the first day just driving straight west. The table below shows the distance traveled as a function of time. b. Find the slope of the line. c. What information about Ben s speed can you obtain from the slope? d. Write an equation to represent the distance traveled after driving a given number of hours. Label each variable. e. A second car is traveling at 50 miles per hour. Suppose you made a graph showing the distance traveled by the second car as a function of time. How would the graph for the second car compare with the graph of Ben s car? Explain your thinking. f. Would it make sense for a line representing this situation to start anywhere but the origin? Be sure to use mathematical reasoning in your response.
What can this problem reveal about how a students understanding is developing during the unit?
David compares the sizes and costs of photo books offered at an online store. The table below shows the cost for each size photo book.
Read the Implementation Notes and the Smarter Balanced rubric. Discuss in your group the benefits and challenges of using these types of tasks to assess student understanding during the course of an instructional unit.
FEEDBACK AND REFLECTION Please fill out the feedback form and turn it in as you sign out. Resources from todays sessions will be available at the UCDMP resource link at http://education.ucdavis.edu/ucdmp-resources. Thank you for coming and see you in March!


