Exploring Iris Dataset: Attribute Analysis and Prediction
This analysis explores the Iris dataset containing 150 samples with continuous features like Sepal Length, Sepal Width, Petal Length, and Petal Width, classified into Setosa, Versicolor, and Virginica species. The focus is on determining the best attributes to predict the species, evaluating the information content, and comparing algorithm performance using Decision Tree and SVM classifiers. Visualizations and correlations are also discussed to gain insights into the dataset.

Download Presentation

Please find below an Image/Link to download the presentation.
The content on the website is provided AS IS for your information and personal use only. It may not be sold, licensed, or shared on other websites without obtaining consent from the author.If you encounter any issues during the download, it is possible that the publisher has removed the file from their server.
You are allowed to download the files provided on this website for personal or commercial use, subject to the condition that they are used lawfully. All files are the property of their respective owners.
The content on the website is provided AS IS for your information and personal use only. It may not be sold, licensed, or shared on other websites without obtaining consent from the author.
E N D
Presentation Transcript
Iris Dataset Question Samuel Cunningham Mingdi Gao
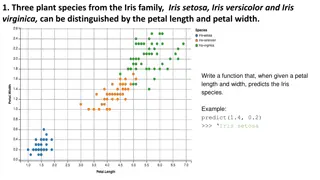
The Data 150 samples Sepal Length and Width (Continuous) Petal Length and Width (Continuous) The species (Setosa, Versicolor, Virginica)
What to find? Which two attributes would be best to use to predict the species? Do these two attributes contain enough information that all other attributes can be ignored? 2 dimensional dataset linearly separable with two lines)
Algorithms Decision Tree DecisionTreeClassifier Gini and Information Gain SVM Scikit learn s nuSVC Kernal: rbf
Training and Prediction results Decision Tree: Recall = 1.0 Precision = 1.0 SVM: Recall = 0.97 Precision = 0.98
Tree Visualization(Info Gain) X[3](Petal Width) appears as the best-split-feature and appear the most. X[2] also appear 3 time while X[1] appear only once and X[0] is not even here.
Tree Visualization(Gini) X[2](Petal Length) appears as the best-split-feature and appear the most. X[3] also appear 3 time while X[0] appear only once and X[0] is not even here.
Attribute Correlation Covariance of two variables divided by the product of their standard deviations. (Pearson product-moment correlation coefficient)
Sepal Length vs. Sepal Width SVM Tree Actual Predicted
Petal Length vs. Petal Width SVM Tree Actual Predicted
Petal Length vs. Sepal Length SVM Tree Actual Predicted
Petal Width vs. Sepal Length SVM Tree Actual Predicted
Separate Attributes Petal Width vs. Sepal Width Petal Length vs. Sepal Length Petal Length vs. Petal Width
Kaggle visualizations https://www.kaggle.com/jrskane/d/uciml/iris/iris-practice
Kaggle visualizations https://www.kaggle.com/benhamner/d/uciml/iris/python-data-visualizations
Conclusion Petal Width / Petal Length Contain the most information Not exactly linearly separable two stages (lines)
Challenges The Question Python Visualizations
Reference http://scikit-learn.org/stable/modules/tree.html#tre http://stackoverflow.com/questions/10570042/visualizing-a- decision-tree-example-f rom-scikit-lea


")
")