Exploring Generosity Trends in the Netherlands Over Twenty Years

A comprehensive study presented at the 13th ISTR Conference in Amsterdam delves into the evolving landscape of generosity in the Netherlands. Researchers Ren Bekkers, Arjen de Wit, and Suzanne Felix from Vrije Universiteit discuss the correlation between generosity and giving, changes in philanthropic behaviors, and the impact on household incomes. The study also touches on the shift towards open science and data sharing within the field of philanthropy.

Download Presentation

Please find below an Image/Link to download the presentation.
The content on the website is provided AS IS for your information and personal use only. It may not be sold, licensed, or shared on other websites without obtaining consent from the author. Download presentation by click this link. If you encounter any issues during the download, it is possible that the publisher has removed the file from their server.
E N D
Presentation Transcript
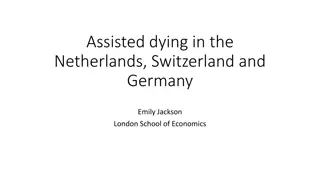
TwentyYearsof Generosity in the Netherlands Ren Bekkers Arjen de Wit Suzanne Felix Center for Philanthropic Studies Vrije Universiteit (VU) Amsterdam 13th ISTR Conference, Amsterdam, July 10, 2018
Thanks To all the sponsors and funders of the Giving in the Netherlands Research, and its initiator, Theo Schuyt. This is work in progress comments are welcome. All materials, i.e. the most recent version of this paper, data and code for this study are available at https://osf.io/t4y8q/ July 10, 2018 13th ISTR Conference 2
Sharing Data is the New Normal http://www.giving.nl/ You can download our data at https://osf.io/4unf9/ https://renebekkers.wordpress.com/2015/11/11/four-reasons-why-we-are-converting-to-open-science/ July 10, 2018 13th ISTR Conference 3
Five questions on generosity How generous are people to others? How is generosity related to giving and how are their correlates different? How has generosity changed in the Netherlands in the past twenty years? How can these changes be explained? How has the strength of relationships between generosity and its correlates changed? July 10, 2018 13th ISTR Conference 4
Giving and generosity Almost all of the research on charitable giving has investigated amounts donated. Generosity is relative the sacrifice that a gift implies. Our measure of generosity is the amount donated by households divided by their income. July 10, 2018 13th ISTR Conference 5
45% 4500 40% 4000 35% 3500 proportion of population 30% 3000 Amount in 25% 2500 20% 2000 15% 1500 10% 1000 5% 500 0% 0 does not give 0 to 0.25% 0.25 to 0.50% 0.50 to 0.75% 0.75 to 1% 1% to 5% 5% to 9.99% 10% or more July 10, 2018 13th ISTR Conference 6
Philanthropy as a proportion of GDP 2.5% 2.0% 1.5% 1.0% 0.5% 0.0% 1995 1997 1999 2001 2003 2005 2007 2009 2011 2013 2015 Netherlands US (Giving USA; Reich & Wimer, 2012) July 10, 2018 13th ISTR Conference 7
Giving and generosity of households 250 0.9 0.8 200 0.7 Proportion of income 0.6 Amount (in ) 150 0.5 0.4 100 0.3 0.2 50 0.1 0 0 1995 1997 1999 2001 2003 2005 2007 2009 2011 2013 2015 amount proportion of income July 10, 2018 13th ISTR Conference 8
Explaining the trend in generosity -3% -41% -36% 11% 8% -1 -0.8 -0.6 -0.4 -0.2 0 0.2 0.4 ageing education religion prosocial income July 10, 2018 13th ISTR Conference 9
Generosity by education over time 1.40 1.20 1.00 0.80 primary secondary 0.60 tertiary 0.40 0.20 0.00 2001 2003 2005 2007 2009 2011 2013 2015 July 10, 2018 13th ISTR Conference 10
Explaining the trend in generosity 0 -0.5 1.Year -0.631 -0.78 -1 2.Age/Gender -1.218-1.12 3.Education -1.5 4.Religious -2 5.Attendance -1.978 6.Prosocial -2.5 -2.527 7.Income -3 -2.933 8.By year -3.5 -3.723 -4 Note: coefficients multiplied by 100 July 10, 2018 13th ISTR Conference 11
July 10, 2018 13th ISTR Conference 12
Generosity by income over time 1.6% 1.4% 1.2% 1.0% 0.8% 0.6% 0.4% 0.2% 0.0% 2001 2003 2005 2007 2009 2011 2013 2015 lowest quintile 2 3 4 top 20% July 10, 2018 13th ISTR Conference 13
Explaining trends in giving () 3.00 2.43 2.00 2.00 1.15 0.86 1.Year 1.00 2.Age/Gender 0.00 3.Education -1.00 4.Religious -0.73 5.Attendance -2.00 6.Prosocial -3.00 -2.88 7.Income -4.00 8.By year -5.00 -4.59 -5.39 -6.00 Note: coefficients reflect changes per year in July 10, 2018 13th ISTR Conference 14
Change in giving () per year 14 10 8.951 Education * year 6 Attendance * year 2.558 2 -2 July 10, 2018 13th ISTR Conference 15
July 10, 2018 13th ISTR Conference 16
Giving to religion and other causes Each declined by 0.01% per year Secularization explains decline in religious giving Secularization and decline of prosocial values are partly responsible for the decline in other giving Prosocial values have a stronger relationship with giving to other causes than with religious giving July 10, 2018 13th ISTR Conference 17
Trends are different among Protestants, those with another (not Catholic) religious affiliation, more frequent church attendees and those with tertiary education They already gave more in 1995 and they have increased their giving even more strongly in the following twenty years The higher generosity in these groups is found for both giving to religion as well as to other causes July 10, 2018 13th ISTR Conference 18
Amounts donated in 800 700 600 500 400 300 200 100 0 1995 2005 2015 average Protestants higher education July 10, 2018 13th ISTR Conference 19
Conclusions The disappearance of religiosity from Dutch society has reduced charitable giving. At the same time those who are still religious have become much more generous. Prosocial values have lost support, and that loss explains about 42% of the decline in generosity. July 10, 2018 13th ISTR Conference 20
Implications, suggestions Strategies and propositions of charitable causes need modification. Traditionally, fundraising organizations have appealed to empathic concern for recipients and prosocial values such as duty. As these have become less prevalent, propositions appealing to social impact with modest returns on investment may prove more effective. July 10, 2018 13th ISTR Conference 21
More implications, suggestions Fundraising campaigns in the past have been targeted primarily at loyal donors. This is not a feasible long term strategy as the size of this group is getting smaller. A new strategy is required to commit new generations of donors. July 10, 2018 13th ISTR Conference 22
Ren Bekkers and Suzanne Felix Center for Philanthropic Studies VU University Amsterdam r.bekkers@vu.nl Blog: http://renebekkers.wordpress.com Twitter: @renebekkers
Household giving as a % of consumer expenditure July 10, 2018 13th ISTR Conference 24
80 70 60 50 55+ not religious 40 catholic 30 protestant 20 10 0 1995 1997 1999 2001 2003 2005 2007 2009 2011 2013 2015 July 10, 2018 13th ISTR Conference 25
76 74 72 70 trust 68 altruistic values empathic concern 66 64 62 60 2001 2003 2005 2007 2009 2011 2013 2015 July 10, 2018 13th ISTR Conference 26
July 10, 2018 13th ISTR Conference 27
July 10, 2018 13th ISTR Conference 28
July 10, 2018 13th ISTR Conference 29
July 10, 2018 13th ISTR Conference 30
July 10, 2018 13th ISTR Conference 31
July 10, 2018 13th ISTR Conference 32
July 10, 2018 13th ISTR Conference 33
July 10, 2018 13th ISTR Conference 34
July 10, 2018 13th ISTR Conference 35


")
 per year")