Evaluation of Neutron Reaction Data and Thermal (n,γ) Data
Explore the evaluation of neutron reaction data and thermal (n,γ) data by Richard B. Firestone at the University of California, Berkeley. Learn about the importance of neutron reaction data for applications in nuclear physics, chemistry, and engineering, along with guidelines for data evaluation and normalization. Dive into details on constructing datasets, normalizing intensities, calculating reduced transition probabilities, and more. Discover the significance of primary references in establishing dataset integrity and accuracy.

Download Presentation

Please find below an Image/Link to download the presentation.
The content on the website is provided AS IS for your information and personal use only. It may not be sold, licensed, or shared on other websites without obtaining consent from the author. If you encounter any issues during the download, it is possible that the publisher has removed the file from their server.
You are allowed to download the files provided on this website for personal or commercial use, subject to the condition that they are used lawfully. All files are the property of their respective owners.
The content on the website is provided AS IS for your information and personal use only. It may not be sold, licensed, or shared on other websites without obtaining consent from the author.
E N D
Presentation Transcript
Evaluation of (n,x ) data Richard B. Firestone University of California, Berkeley Lawrence Berkeley National Laboratory Berkeley, CA 94720, USA IAEA Specialized Workshop on NSDD Evaluations Vienna, Austria, 27-29 April 2015
General Motivations Neutron reaction data are important for applications in nuclear physics, chemistry, and engineering. They should be evaluated to produce complete, adopted (n,x ) datasets. Results from different neutron reactions should not be combined. Gamma-ray intensities should be normalized to obtain P values. Cross section normalizations should be given when available. Reduced photon strengths should be calculated.
Thermal (n, ) Data A single dataset containing primary and secondary -rays on the same intensity scale should be constructed. Intensities should be normalized to give both P and using the following primary references 1. Zs. Revay and G. L. Molnar, Standardisation of the prompt gamma activation analysis method, Radiochim. Acta 91, 361 369 (2003). 2. Database of Prompt Gamma Rays from Slow Neutron Capture for Elemental Analysis, STI/PUB/1263,ISBN 92 0 101306 X, International Atomic Eneregy Agency, Vienna, 2007, http://www-pub.iaea.org/MTCD/publications/PDF/Pub1263_web.pdf. 3. Zs. Revay et al, Handbook of Prompt Gamma Activation Analysis, ed. G.L. Molnar, Kluwer Academic Publishers, Dortrecht, 2004. 4. F. De Corte and Andras Simonits, Recommended nuclear data for use in the k0 standardization of neutron activation analysis, At. Data Nucl. Data Tables 85, 47 67 (2003) . 5. S.F. Mughabghab, Atlas of Neutron Resonances, Elsevier, 2006. P = from references 1-4, from reference 5 or evaluation.
Thermal (n, ) Data A summary of previous measurements, compiled from EXFOR and NSR, should be given in the comments. Mughabghab s recommended value should be given in the comments. Sn should be calculated by a least-squares fit of primary -rays to the level scheme and compared with the AME value. Expected mulipolarities, based on J of final level, M1, E1, or E2 should be given for primary -rays. The effective spin and parity of the capture state should be given in the J field based on ( ) from Mughabghab s Atlas. There should be a comment discussing the relative spin and parity contributions. 156Gd example Mughabghab Atlas 156GD L 8536.20 5 2- 0.110 eV 3 156GD cL J$|s{-|g}(2-)=60874 b, |s{-|g}(1-)=14 b (2006MUZX)
Thermal (n, ) Data Calculate reduced transition probabilities for primary -rays. Use Brink- Axel E1 calculation rather than Weisskopf single particle estimates. ?????? = ????? /??? , , where P is the transition probability per decay, is the capture state width, and E is the -ray energy in MeV. ????? ?? ? ??? ? ?? ?, where ???, ??, ??? are the energy, ?=? ?(? ?)? ?=? ????? = ? ?? ?)?+?? (?? 1 3= 8.68 10 8, and D0 is the width, andcross section for the GDR, 3 ? capture state level density. In deformed nuclei there are two (i=1,2) sets of GDR https://www-nds.iaea.org/RIPL-3/ parameters. The GDR parameters ???, ??,???can be obtained from RIPL3 at https://www-nds.iaea.org/RIPL-3/. B(E1,M1)BA = fexp(E )/fBA(E ) reduced transition probability, e.g for 56Fe(n, )57Fe 57FE G 7278.76 19 48 3 57FE cG B(E1){-BA}=0.23 57FE G 7631.06 8 228 4 57FE cG B(E1){-BA}=0.86 57FE G 7645.48 8 200 3 57FE cG B(E1){-BA}=0.75 ???= ??.?? ??? ???= ?.? ??? ???= ??? ??
Thermal (n, ) Data The Rydberg-Ritz Combination Principle is the theory proposed by Walter Ritz in 1908 to explain the relationship of the spectral lines for all atoms. The principle states that the spectral lines of any element include frequencies that are either the sum or the difference of the frequencies of two other lines. This method is used by authors and evaluators in reverse to find new (n, ) levels but it is not generally valid due to the complexity of the spectrum. For example in 56Fe(n, )57Fe we resolve 449 -rays from 0-7646 keV, for an average separation of 17 keV. There is a 1/17 chance that a transition energy will match a level energy difference within 1 keV. With the aid of coincidence data 32 levels in 57Fe previously assigned by energy sums and adopted in ENSDF were found not to exist. Do not adopt levels found by energy sums unless Their existence is confirmed by other reaction measurements At least 3-4 interconnecting transitions can be found whose energies match well
Thermal (n, ) Data Sum coincidence, Esum=7646. 4725.69(24) keV -ray from 56Fe(n, ) Previously placed as primary E1 -ray populating 2920.56-keV level E =4726 keV E (calc)=4725.62 keV Not observed in coincidence with 2920.56-keV -ray! Alternative placement from 6252.85(5) keV (1/2,3/2,5/2+) level to 1627.29(2) keV 3/2 level Sum coincidence, Esum=7646-1627 E =4726 keV E (calc)=4725.56(5) keV Transition observed in coincidence with the 1627.29 keV -ray!
Thermal (n, ) Data Level scheme intensity balance. The transition intensity balance through the level scheme should be evaluated to search for large discrepancies. P deexciting the capture state or populating the ground state should be <100% for all but the lightest isotopes. P feeding excited states should approximately equal P depopulating those states. Large discrepancies should be addressed by proposing new interconnecting transitions, modifying ICC values, or finding multiple -ray placements. Discuss these in comments. Intensity balance information should be reported on second level record, e.g. 57FE L 0.0 1/2- 57FE cL P{_|g}(in)=99.7 13 57FE L 14.399 73/2- 98.2 NS 3 57FE cL P{_|g}(out-in)=0 57FE G 14.394 8 54.3 8 M1+E2 0.0022318 8.59 57FE cG RI$From intensity balance 57FE L 136.444 10 5/2- 8.7 NS 3 57FE cL P{_|g}(out-in)=021 8
Thermal (n, ) Data Statistical model considerations: Evaluators should take into account the statistical population/depopulation of (n, ) levels. A formal calculation with DICEBOX is desirable but beyond the feasibility of most evaluators. Some statistical considerations can be made without formal calculations. (n, ) will populate all low-lying levels with J =J (CS) 1 with comparable intensities to nearby levels of the same spin. Levels not populated either don t exist or have different spins. (n, ) will populate low-lying levels with J =J (CS) 2,3 with significantly lower intensity. (n, ) will populate all low-lying levels with J =J (CS) 4,5 very weakly if at all.
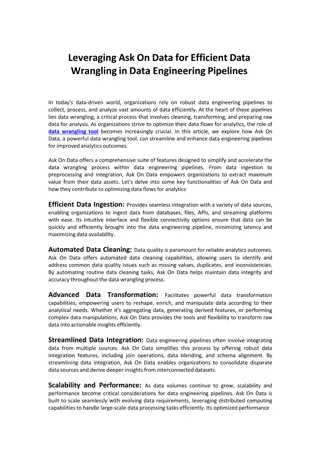
Thermal (n, ) Data 100 186W(n, ) 10 Feeding Intensity 1 1/2- 3/2- 5/2- 0.1 7/2- 9/2- 11/2- 0.01 0.001 0 0.2 0.4 0.6 0.8 1 Level Energy (MeV) 186W(n, ) feeding intensity patterns can be used by evaluators to constrain J values. A.M. Hurst et al, Phys. Rev. C 89, 014606 (2014)
(n, ) activation data Adopted activation decay dataset should be extended to include Adopted (n, ) production cross section Individual -ray cross sections from references 2 and 4. Normalization to k0 value from references 2 and 4. Decay scheme normalization should be compared with normalization derived from data were P = Activation -ray cross sections have been observed in EGAF measurements and are reported by de Corte and Simonits. Some precise 4 measurements have been found to be inaccurate.
ARC (n, ) Data ARC data experimentally invoke the statistical properties of photon strengths to distinguish M1 from E1 strength assuming s-wave capture. See L. M. Bollinger and G. E. Thomas, Average-Resonance Method of Neutron- Capture y-Ray Spectroscopy: States of 106Pd, 156Gd, 158Gd, 166Ho and 168Er, Phys. Rev, C2, 1951 (1970). Intensities frequently given as I /E 3 or I /E 5should be corrected to I . Evaluator should recheck J arguments based on ARC. Comparison should be based on I /E 3,not I /E 5, or better by f /fBA. An intensity normalization to per 100 neutron captures should be given either from experiment or calculated based on (n, ) thermal data as follows. ? ? ???/ ? ? = 100 ??? ??? 1 1 Summed over primary -rays to matching levels in thermal and ARC data. Calculate reduced transition probabilities f . Mulipolarities should be given on -ray records. Capture state energy uncertainty should span ARC resonance region.
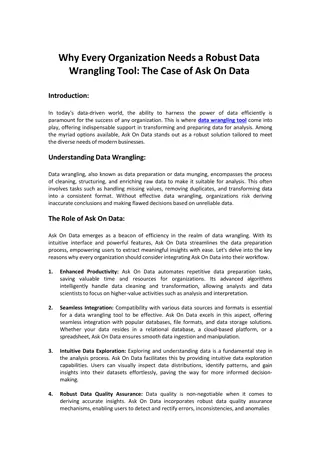
ARC (n, ) Data 10 156Gd ARC capture states have J =1 ,2 . Favored transitions to levels with J=1,2 can be populated from both capture states and should have twice the population as levels with J=0,3 which can only be populated by one of the states. 156Gd ARC f /fBA 1 J=0,3 E1 J-1,2 E1 J=0,3 M1 J=1,2 M1 M1,E1 Doublet J=2,3 E1 Doublet ?=? ????? ?? ? ??? ? ?? ????? = ?(? ?)? ? ? ?? ?)?+ ?? (?? ?=? ?????? = ????? /??? 0.1 GDR Parameters 6 6.5 7 E (MeV) 7.5 8 8.5 ???= ??.?? ???, ???= ??.?? ??? ???= ?.?? ???, , ???= ?.?? ??? ???= ???.? ??, ??= ?.? ??, ??? = ?.??? ?? L. M. Bollinger and G. E. Thomas, Average- Resonance Method of Neutron-Capture y-Ray Spectroscopy: States of 106Pd, 156Gd, 158Gd, 166Ho and 168Er, Phys. Rev, C2, 1951 (1970). ???= ???.? ??
(n,n ) data Separate datasets for each experiment Bagdad Atlas data (1978De41) Add missing -rays from Adopted Levels, Gammas Normalize data to per 100 reactions, ???? = 100 Give normalization with respect to 847 keV -ray from 56Fe(n,n ) using Bagdad Atlas. Give data on experimental neutron spectrum This reaction is not selective so all levels of comparable spin should be populated. Adopted levels not seen in (n,n ) are questionable.
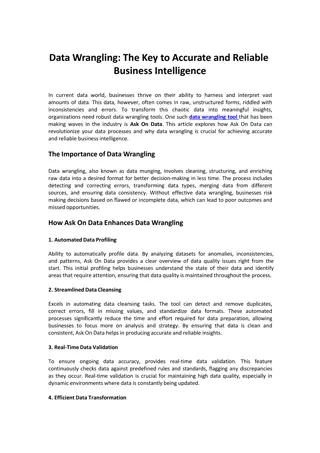
(n,n ) data 10 56Fe(n,n' ) Feeding Intensity 0+ 1+ 2+ 3+ 4+ 6+ 3- 1 0.1 2 3 4 5 Level Energy For 56Fe inelastic scattering there is little selectivity for populating levels with J =1-4+ with fission neutrons. All levels in this spin range should be populated.
Resonance capture (n, ) data Evaluate like (n, ) thermal data Normalize like ARC data Calculate reduced transition probabilities f Multiple resonance (n, ) datasets can be combined for ARC analysis. Resonance parameters Include resonance properties and all data for all resonances from Mughabghab Atlas. Updating should be left to reaction evaluation community.
Dissemination of (n,x ) data The (n,x ) database will be edited and evaluated by the UCB/LBNL/LLNL Bay Area Nuclear Group (BANG) and provided to the IAEA for dissemination. EGAF thermal P , , , Sn, and activation data will be provided for future updates of the IAEA database https://www-nds.iaea.org/pgaa/. EGAFNN (n,n ) P , data will be provided to the IAEA, beginning with the Bagdad Atlas, as a subset of EGAF. EGAFRES ARC and resonance (n, ) P data will be evaluated and provided to the IAEA as a subset of EGAF. ENSDF complete Adopted Levels, Gammas evaluations will be performed on (n, ) and (n,n ) isotopes and submitted for inclusion into ENSDF. RIPL ENSDF evaluations will be modified to conform to the needs of the RIPL file in collaboration with the IAEA. Interested collaborators are encouraged to join the (n,x ) evaluation effort.
 data")

 Data")
 Data")
 Data")
 Data")
 Data")
 Data")
 Data")
 Data")
 Data")
 Data")
 activation data")
 Data")
 Data")
 data")
 data")
 data")
 data")