Evaluating Dynamic Changes in HIV Risk Profile for Treatment Interruptions
Understanding the dynamic nature of risk profiles in HIV treatment interruptions is crucial for effective care. Researchers have developed machine learning models and threshold approaches to predict and triage patient risks, highlighting the importance of continuous risk assessment in the care journey.
Download Presentation

Please find below an Image/Link to download the presentation.
The content on the website is provided AS IS for your information and personal use only. It may not be sold, licensed, or shared on other websites without obtaining consent from the author.If you encounter any issues during the download, it is possible that the publisher has removed the file from their server.
You are allowed to download the files provided on this website for personal or commercial use, subject to the condition that they are used lawfully. All files are the property of their respective owners.
The content on the website is provided AS IS for your information and personal use only. It may not be sold, licensed, or shared on other websites without obtaining consent from the author.
E N D
Presentation Transcript
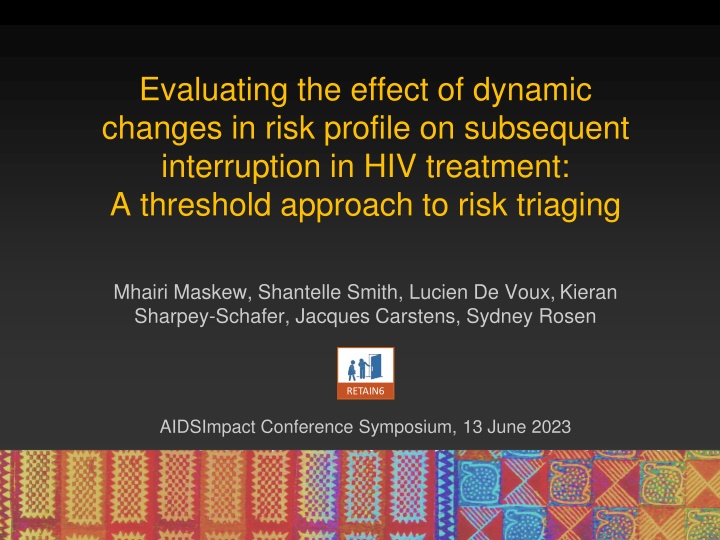
Evaluating the effect of dynamic changes in risk profile on subsequent interruption in HIV treatment: A threshold approach to risk triaging Mhairi Maskew, Shantelle Smith, Lucien De Voux,Kieran Sharpey-Schafer, Jacques Carstens, Sydney Rosen RETAIN6 AIDSImpact Conference Symposium, 13 June 2023
The HIV care journey Continuity of HIV care is critical yet challenging, especially in the early treatment period RETAIN6: Models of care for the first six months of HIV treatment Optimize service delivery during the early treatment period About half of initiating clients experience an interruption in treatment during the first 12 months on ART* *Maskew, Benade, RETAIN6 Policy Brief 2023 https://sites.bu.edu/ambit/the-retain6-project
Do we have the methods and tools needed to predict risk of treatment interruptions? Machine learning model trained on: Large routinely collected EMR data (>310,000 clients) Clinical trial dataset (881 clients) Model predicted risk score for treatment interruption for each observed visit Tested against known visit outcomes Predicted 2 of 3 treatment interruptions Source: Maskew et al. (2022)
Can risk scores be used to triage patients? Threshold approach - groups are segmented based on a visit-based risk score lowest 50% of scores assigned a green or low risk category middle 40% of scores assigned a yellow or moderate risk category; highest 10% of scores assigned a red or high-risk category Top ~10%most at risk visits High Middle ~40%moderately at risk visits Moderate Low Bottom ~50% least at riskvisits
Does risk of IIT differ across predicted thresholds? HIGH risk = 55% IIT (N = 720) LOW risk = 3% IIT (N = 3600) MOD risk = 16% IIT (N = 2879)
Risk is dynamic Individual circumstance, experiences, life events, and perceptions change over time This impacts health-seeking behavior and risk of treatment interruption Risk score can be estimated at each ART client encounter
Distribution of change in risk state Risk is not static Shifts in risk state across visits occur frequently
Distribution of change in risk state Risk is not static Shifts in risk state across visits occur frequently Clustering of shift towards increasing risk state during first 6 months on ART
Risk state changes and IIT Current visit risk state classification Moderate risk Low risk High Risk N (%) with indicated risk state change between previous and current visit 2,658 (85%) 436 (14%) 37 (1%) Low risk % Observed current visits classified as treatment interruption (IIT) IIT=7% (n=185) IIT=16% (n=69) IIT=35% (n=13) Previous visit risk state N (%) with indicated risk state change between previous and current visit N=736 (28%) N=1,630 (62%) N=267 (10%) Moderate risk % Observed current visits classified as treatment interruption (IIT) IIT 8% (n=62) IIT 16% (n=261) IIT 26% (n=68) N (%) with indicated risk state change between previous and current visit N=43 (7%) N=352 (56%) N=231 (37%) High Risk % Observed current visits classified as treatment interruption (IIT) IIT 14% (n=6) IIT 17% (n=61) IIT 32% (n=73)
Risk state changes and IIT Current visit risk state classification Moderate risk Low risk High Risk N (%) with indicated risk state change between previous and current visit 2,658 (85%) 436 (14%) 37 (1%) Low risk % Observed current visits classified as treatment interruption (IIT) IIT=7% (n=185) IIT=16% (n=69) IIT=35% (n=13) Previous visit risk state N (%) with indicated risk state change between previous and current visit N=736 (28%) N=1,630 (62%) N=267 (10%) Moderate risk % Observed current visits classified as treatment interruption (IIT) IIT 8% (n=62) IIT 16% (n=261) IIT 26% (n=68) N (%) with indicated risk state change between previous and current visit N=43 (7%) N=352 (56%) N=231 (37%) High Risk % Observed current visits classified as treatment interruption (IIT) IIT 14% (n=6) IIT 17% (n=61) IIT 32% (n=73)
Risk state changes and IIT Current visit risk state classification Moderate risk Low risk High Risk N (%) with indicated risk state change between previous and current visit 2,658 (85%) 436 (14%) 37 (1%) Low risk % Observed current visits classified as treatment interruption (IIT) IIT=7% (n=185) IIT=16% (n=69) IIT=35% (n=13) Previous visit risk state N (%) with indicated risk state change between previous and current visit N=736 (28%) N=1,630 (62%) N=267 (10%) Moderate risk % Observed current visits classified as treatment interruption (IIT) IIT 8% (n=62) IIT 16% (n=261) IIT 26% (n=68) N (%) with indicated risk state change between previous and current visit N=43 (7%) N=352 (56%) N=231 (37%) High Risk % Observed current visits classified as treatment interruption (IIT) IIT 14% (n=6) IIT 17% (n=61) IIT 32% (n=73)
Current visit risk state classification Low risk Moderate risk High Risk 85% 14% 1% Low risk Previous visit risk state IIT=7% (n=185) IIT=16% (n=69) IIT=35% (n=13) 28% 62% 10% Moderate risk IIT 8% (n=62) IIT 16% (n=261) IIT 26% (n=68) 7% 56% 37% High Risk IIT 14% (n=6) IIT 17% (n=61) IIT 32% (n=73) Change in risk states are important any ascending risk shift (G Y R) doubles risk of IIT State changes tend to occur in transition only 1% of visits switch from low to high risk states Observing these shifts can prompt intervention proactive approach
What does this tell us? The first 6 months on ART is a critical period for establishing continuity of ART care patterns of visit attendance predict treatment interruption Risk of treatment interruption is not static; individual risk shifts across time and circumstance Change in risk state has an impact on subsequent treatment interruption Awareness of change in risk can allow us to engage ART clients proactively before disengagement occurs New guidelines in South Africa shift eligibility for differentiated models of HIV service delivery to month 4 Will it be early enough?
Acknowledgements Funding for the Retain6 study was provided the Bill & Melinda Gates Foundation through OPP1192640 to Boston University Study team: Health Economics and Epidemiology Research Office, University of the Witwatersrand, Johannesburg, South Africa Department of Global Health, Boston University School of Public Health, Boston, MA, USA Palindrome Data, Cape Town South Africa RETAIN6
