Equivalent Fractions: Modeling and Analysis
Delve into the world of equivalent fractions by choosing one from the provided denominator and numerator ratio, finding five additional equivalent fractions, recording them in a data table, and graphing the results. An in-depth reflection explores similarities and differences between graphs, determining steepness/slope, and analyzing ratios of numerators to denominators for learning and discovery.

Download Presentation

Please find below an Image/Link to download the presentation.
The content on the website is provided AS IS for your information and personal use only. It may not be sold, licensed, or shared on other websites without obtaining consent from the author.If you encounter any issues during the download, it is possible that the publisher has removed the file from their server.
You are allowed to download the files provided on this website for personal or commercial use, subject to the condition that they are used lawfully. All files are the property of their respective owners.
The content on the website is provided AS IS for your information and personal use only. It may not be sold, licensed, or shared on other websites without obtaining consent from the author.
E N D
Presentation Transcript
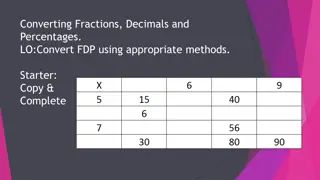
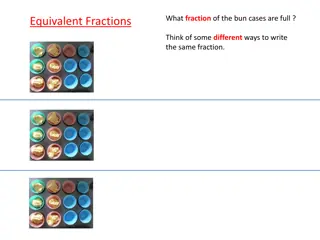
What are some fractions equivalent to ? Denominator (x) 2 Numerator (y) 1
Denominator (x) 2 Numerator (y) 1
1. Choose one of the fractions listed below: 2. Write five other fractions equivalent to the fraction you choose. 3. Record your fractions in the table. 4. Graph the data using the paper on your desk (Denominator on x-axis; numerator on y-axis)
Reflection How are the graphs alike? Different? Which graph has the greatest steepness/slope? Why? How can the graph be used to determine numerators and denominators for other equivalent fractions? Examine the ratios of numerator to denominator. What do you notice?


")