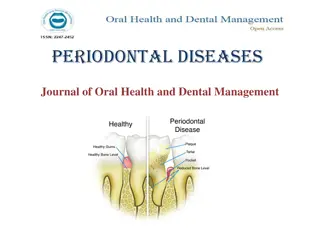
Epidemiology of Periodontal & Gingival Diseases
Epidemiology is the study of disease distribution and determinants in populations for effective control and prevention. It plays a crucial role in understanding the prevalence, risk factors, and effectiveness of preventive measures for periodontal and gingival diseases. Classification systems and the application of epidemiological data contribute to promoting, protecting, and restoring oral health.
Download Presentation

Please find below an Image/Link to download the presentation.
The content on the website is provided AS IS for your information and personal use only. It may not be sold, licensed, or shared on other websites without obtaining consent from the author.If you encounter any issues during the download, it is possible that the publisher has removed the file from their server.
You are allowed to download the files provided on this website for personal or commercial use, subject to the condition that they are used lawfully. All files are the property of their respective owners.
The content on the website is provided AS IS for your information and personal use only. It may not be sold, licensed, or shared on other websites without obtaining consent from the author.
E N D
Presentation Transcript
Epidemiology of Periodontal & Gingival Diseases
Learning objectives Need for classification previous classification 1999 AAP classification new classification 2017
Epidemiology, derived from Greek word epi, meaning "upon, among", demos, meaning "people, logos, meaning "study,
What is Epidemiology? The study of the distribution and determinants of health-related states in populations, and the application of this study to control health problems Basic Science of Public Health
Public Health deals with health of Community group or population Clinical practice deals with health of an individual.
Epidemiology Definition implies Determining amount & distribution of disease Investigation of causes of disease Applying this knowledge for control of disease 1. 2. 3.
The final purpose of Epidemiology is to apply the knowledge gained through studies to Promote Health Protect Health Restore Health
Distribution of diseases Distribution of diseases/periodontal diseases in populations is not random Some members or subgroups of the population are more susceptible Physical, biologic, behavioral, cultural and social factors
Epidemiology in periodontics should provide information about: 1. Prevalence & severity 1. Risk factors 1. Effectiveness of preventive & therapeutic measures
Classification of Periodontal Diseases Numerous Classifications existed in the past World workshop in periodontics 1989 AAP classification 1999
Periodontal Diagnosis Great importance Distinguishing between Normal & Abnormal is based on thresholds Thresholds are derived from epidemiological studies
Study Designs Cross-sectional studies Prevalence Case-control studies Risk Indicators (rare diseases) Cohort studies Incidence
Definitions Prevalence Incidence Sensitivity Specificity Positive predictive value Negative predictive value
Prevalence Proportion of persons in a population who have the disease at a given point or period of time Prevalence = No of persons with disease No of persons in the population
Incidence Average percentage of unaffected persons who will develop the disease of interest during a given period of time Incidence = No of new cases No of persons at risk
Incidence of periodontal diseases in a strict sense is almost impossible at the present level of knowledge.
Sensitivity Proportion of subjects with the disease who test positive Sensitivity = No of subjects who test positive No of subjects with disease
Specificity Proportion of subjects without the disease who test negative Specificity = No of subjects who test negative No of subjects without disease Sensitivity and specificity are useful in choosing the test
Predictive Value Once the result of a test is ready: what are the chances that it is right or wrong? Predictive value
Predictive Value Positive predictive value of a test: Probability that a person with a positive test has the disease Negative Predictive Value: probability that a person with a negative test does not have the disease
True Disease Status Test Result Disease No Disease Positive A B True +ve C False -ve A/(A+C) False +ve D True -ve Negative Sensitivity Specificity B/(B+D) Positive predictive value A/(A+B) Negative predictive value D/(C+D)
Periodontal Indices Techniques employed in periodontal epidemiology to quantitate clinical conditions on a graduated scale to facilitate comparison among populations Complete periodontal examination is Superior BUT Time consuming Does not translate clinical conditions into numerical data
Ideal Index Simple & quick to use Accurate Reproducible Quantitative
Indices Gingival health/bleeding Plaque Calculus Attachment loss Radiographic bone loss Treatment needs
Periodontal Indices Indices measuring the degree of gingival inflammation Example: Gingival index (GI; L e & Silness; 1967) Modified Gingival Index (Lobene et al, 1986)
Periodontal Indices Indices used to measure periodontal destruction Example: Periodontal Index (PI, Russel; 1956) Periodontal Disease Index ( Ramfjord, 1959)
Periodontal Indices Indices used to measure plaque accumulation Example: Plaque Index (Silness & L e, 1964)
Periodontal Indices Indices used to measure calculus Example: Calculus component of the PDI
Periodontal Indices Indices used to assess treatment needs Example: Community Periodontal Index Of Treatment Needs (CPITN) Ainamo et al, 1977
Prevalence of Periodontal Diseases National Health & Nutrition Examination Survey NHANES I (1971-1974) NHANES III (1988-1994) NIDR (1985-1986) Difficult to compare results
Prevalence of Periodontal Diseases Geographic distribution More than 70% of adults have some degree of gingivitis or periodontitis Gingivitis and calculus are more prevalent and severe in developing countries
Gingivitis At the population level Found in early childhood Prevalence & severity in adolescence Prevalence of gingivitis in USA among population aged 13 and older= 54%
Gingival Bleeding NHANES III Highest among 13-17 yr old (63%) Declined through 35- to 44-yr-old group Increased in 45- to 54- yr old group
Gingivitis In Adults First national survey in US (1962): 85% of men & 79% of women had gingivitis ??Gingivitis has declined in developed countries??
Prevalence of Chronic Periodontitis Depends on: Population & Threshold definition NHANES III: > 1mm prevalence=99% : > 3mm AL in at least one site of the mouth= 53% : > 7mm =7%
Prevalence of Aggressive Periodontitis Differs with populations In the US: 0.13%, 0.53% and 1% prevalence has been reported
Confusion Confusion in interpreting data from older studies, due to differences in measurement Severity of periodontitis according to AAP CAL (PAL; LPA)
Incidence of Periodontitis Longitudinal study of periodontitis on 480 tea workers in Sri Lanka (L e et al 1986) Revealed natural history of disease Parallel Study in Norway
Results 8% rapid progression 81% moderate progression 11% no progression beyond gingivitis GR progresses on all surfaces In Norway; upper SES: GR buccally Reason for CAL in both groups
Bacteria Colonisation Invasion Destruction Host Environmental Smoking Susceptibility Genetic Acquired Periodontal Diseases
Aetiology Risk Factors Susceptibility factors Severity factors
Risk Identified in terms of: Risk Factors Risk Indicators Risk predictors (Pihlstrom, 2001)
Risk factors Identified through Longitudnal studies Examples 1. Tobacco Smoking 2. Diabetes 3. Pathogenic Bacteria 4. Microbial tooth deposits
Risk Determinants Also called Background Characteristics Cannot be modified Examples 1. Genetic factors 2. Age 3. Gender 4. Socioeconomic status 5. Stress
Risk Indicators Are probable risk factors that have been identified in Crossectional studies but not in longitudnal studies Examples 1. HIV/AIDS 2. Osteoporosis 3. Infrequent dental visits
Risk markers/ Predictors Are associated with increased risk for disease but do not cause disease Identified in Crosssectional and longitudnal studies Examples 1. Previous history of Periodontal disease 2. Bleeding on probing
Gender & Race Men have poorer periodontal health than women, in terms of LPA, pockets and subgingival calculus Women have better oral hygiene No established differences in susceptibility to chronic periodontitis
Gender Aggressive Periodontitis Studies on Europeans show higher prevalence of aggressive periodontitis in FEMALES > MALES Studies on Africans or African Americans: MALES > FEMALES Gender is related to race (risk factors)
Age Cross-sectional studies: Greater prevalence & severity of CALwith age Does not mean greater susceptibility Cumulative progression of lesions over time Sri Lankan study: 3 groups Increased CAL with age (cumulative effect) Increased susceptibility


