Ensemble of Trees: Boosting, Bagging, and Random Forest
Ensemble of Trees explores various tree-based methods such as CART, MARS, Boosting, Adaboost, Gradient Boosting, Bagging, and Random Forest. It delves into the concept of partitioning the feature space, fitting simple models in rectangles, recursive vs. non-recursive partitioning, regression trees, optimal pruning, classification trees, and the library(tree) section from the Introduction to Statistical Learning with R. Additionally, it covers regression trees, recursive binary splitting, the importance of tree size, and the concept of multivariate adaptive regression splines (MARS) for high-dimensional problems.

Download Presentation

Please find below an Image/Link to download the presentation.
The content on the website is provided AS IS for your information and personal use only. It may not be sold, licensed, or shared on other websites without obtaining consent from the author.If you encounter any issues during the download, it is possible that the publisher has removed the file from their server.
You are allowed to download the files provided on this website for personal or commercial use, subject to the condition that they are used lawfully. All files are the property of their respective owners.
The content on the website is provided AS IS for your information and personal use only. It may not be sold, licensed, or shared on other websites without obtaining consent from the author.
E N D
Presentation Transcript
Ensemble of Trees: Boosting, Bagging, and Random Forest
Outline Tree based methods CART MARS Boosting Adaboost for Classification Gradient Boosting Method Bagging Random Forest
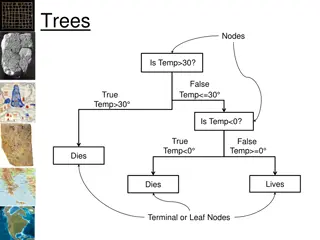
Tree based methods: CART Tree-based methods partition the feature space into a set of rectangles, and then fit a simple model (like a constant) in each one. A recursive partition Nonrecursive partition
Tree based methods Left: Tree representation for the recursive partition above; Right: piecewise constant function on the tree
Regression Trees P inputs and a response (x_i,y_i),i=1,2,...,N Goal: automatically decides on the splitting variables and split points, and also the topology (shape) of the tree Alg: suppose we know the partition R_1,R_2,...,R_M
Regression Trees Recursive binary splitting of variable in greedy way
Tree size Large tree might over-fit the data Small tree might not capture the important structure Tree size is a tuning parameter Stop the splitting process only when some minimum node size (say 5) is reached Then this large tree is pruned using cost complexity pruning
Classification Trees The target variable is a classification outcome taking values 1,2,...,K The only change needed is the criteria for splitting nodes and pruning the tree. Measures of node impurity:
Library(tree) Section 8.3, Introduction to Statistical Learning with R Classification tree Regression tree model = tree(y~., data)
MARS Multivariate Adaptive Regression Splines Well suited for high-dim problems A generalization of stepwise linear regression It uses expansions in piecewise linear basis functions of the form:
MARS A reflected pair
MARS Where is a function in , or a product of two or more such functions. Adaptive way to add basis functions:
MARS The size of terms matters M is the effective number of parameters in the model: this accounts both for the number of terms and the number of parameters when selecting the positions of the knots.
Boosting Originally designed for classification problems Can be extended to regression problems Motivation: combines the output of many weak classifiers to produce a powerful committee (How to boost a weak classifier which is slightly better than random guess to a strong one Leslie Valiant problem) What are weak classifiers? How to combine them? Here we present a statistical point of view.
Whats weak classifiers In theory, weak classifiers have expected error rate <1/2, but impossible to design with finite samples In practice, Rob Schapire points out two elements about weak classifiers: Each classifier is simple, decided locally by small number of samples Classifiers are independent, not highly correlated through using all samples So CART (classification-and-regression-trees) are good candidates for weak classifiers
Adaboost Consider a two-class problem: G(X) is the classifier Error rate: Weak classifier: error rate is only slightly better than random guessing.
Adaboost Boosting sequentially apply the week classification algorithm to repeatedly modified versions of the data, thereby producing a sequence of weak classifiers:
Adaboost.M1 Freund and Schapire 1997
Example: Decision Stumps 2000 trains and 10,000 tests Weak classifier is just a stump: a two terminal node classification tree. Error rate: 48.5%
Boosting Fits and Additive Model Boosting is a way of fitting an additive expansion in a set of elementary basis functions. For Adaboost, basis functions are weak classifiers More generally, Additive Model:
Forward Stagewise Additive Modeling
Exponential Loss and AdaBoost Adaboost is equivalent to forward additive modeling using the following loss function: Forward step:
Joint optimization Step I: Optimizer over G:
Exponential Loss reduction goes further than misclassification error
Why Exp Loss? Boosting the Margin Computational reason Leads the simple reweighting scheme Question: what does adaBoost estimate? Look at population minimizer
AdaBoost vs. LogitBoost In population, AdaBoost LogitBoost: It is the same maximal binomial log-likelihood (deviance) in population
Loss functions and Robustness: classification
Loss functions and Robustness: Regression For regression Huber Loss
Other Interpretations on Boosting Leo Breiman, Freund and Schapire, Game Theoretic View Tong Zhang, Bin Yu, Early Stopping Regularization in convex optimization Peter Buhlman, Bin Yu; Yuan Yao, Andrea Caponnetto and Lorenzo Rosasco, Early Stopping in RKHS Peter Bartlett, Schapire et al.; Liwei Wang, Margin distribution boosting
Gradient Boosted Models Library( gbm ) Section 8.3.4, ISLR. model = gbm(y~x, data, distribution,n.trees,interaction.depth) distribution = [ gaussian ]| Bernoulli n.trees = 1000, number of trees interaction.depth = 2, the depth limit of each tree
Bagging (Leo Breiman 1996) Bootstrap can be used to assess the accuracy of a prediction or parameter estimate Bootstrap can also be used to improve the estimate or prediction itself. Reduce variances of the prediction
Bagging in Reduction of Variance If is linear in data, then bagging is just itself. Take cubic smooth spline as an example. Property: x fixed
Bagging Classifiers Classifier f ( = ) ( ), 1 x e x j k j Bagging the classifier: f = = * * * * b b b N i = b ( , ) , , 1 , Z x y b B 1 i i 1 B f f = = * b ( ) ( ) ( , , ) x x p p 1 bag k , 1 [ ] b B f G ( = ) max 1 ( ) x x bag j k j
Bagging Classifiers Bagging is not good for 0-1 loss Wisdom of Crowds
Bumping Find a better single model.
Random Forest Suppose there is a very strong predictor, along with a small set of moderately strong ones: most of bagged trees will split this strong predictor on the top, since they look at all the predictors in every bootstrap correlation of bagged trees Random forests provide an improvement over bagging byway of decorrelating the trees
Random Forest (Leo Breiman 2001)
Variable Importance Gradient-Boosted Methods: at each split in each tree, the improvement in the split-criterion is the importance measure attributed to the splitting variable, and is accumulated over all the trees in the forest separately for each variable OOB prediction power: for the b-th tree, use OOB samples to estimate the prediction accuracy; then the values for the j-th variable are randomly permuted in the OOB samples and recompute the prediction accuracy; The accuracy decrease of such a permutation is averaged over all trees, as a measure of the importance of variable j in the random forest
Library(randomForest) http://www.math.usu.edu/~adele/forests model = randomForest(formula, data, mtry, ntree, importance, subset) formula = y~. mtry = [p/3]|[\sqrt{p}]|<=p, m is the number of variables to explore in random forest, if m=p it gives Bagging p/3 for regression \sqrt{p} for classification importance=True|False importance(model): show the variable importance


")


")