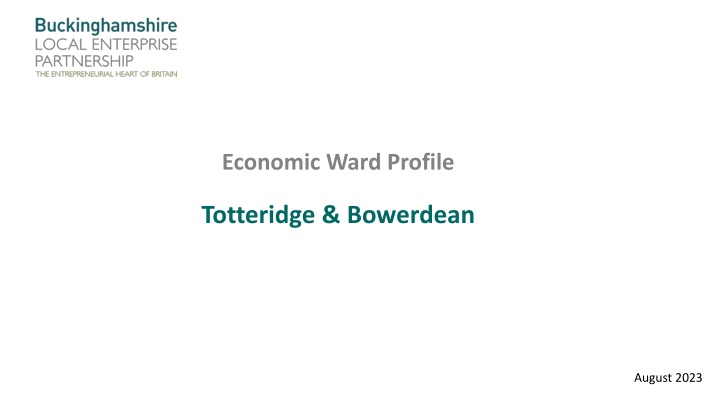
Economic Ward Profile: Totteridge & Bowerdean, Buckinghamshire - August 2023
The Economic Ward Profile for Totteridge & Bowerdean in Buckinghamshire provides insights into the local economy, residents, and potential barriers to employment. With key statistics, fast facts, and comparisons with Buckinghamshire and England averages, this profile offers a comprehensive overview to inform initiatives like the Opportunity Bucks program.
Download Presentation

Please find below an Image/Link to download the presentation.
The content on the website is provided AS IS for your information and personal use only. It may not be sold, licensed, or shared on other websites without obtaining consent from the author.If you encounter any issues during the download, it is possible that the publisher has removed the file from their server.
You are allowed to download the files provided on this website for personal or commercial use, subject to the condition that they are used lawfully. All files are the property of their respective owners.
The content on the website is provided AS IS for your information and personal use only. It may not be sold, licensed, or shared on other websites without obtaining consent from the author.
E N D
Presentation Transcript
Economic Ward Profile Totteridge & Bowerdean August 2023
About this profile Buckinghamshire LEP have produced a set of economic profiles for the 10 wards of Buckinghamshire where people are experiencing the most hardship to inform the work of the Opportunity Bucks programme. The 10 wards are: This profile is for the Totteridge & Bowerdean ward in High Wycombe. It sets out: An overview of the local economy (including key businesses, employment hotspots, high growth firms and key employment sites) Town Ward Aylesbury Aylesbury North Aylesbury North-West Aylesbury South-West A profile of residents (including demographics and labour market status) Chesham Analysis of potential barriers to employment (including health, transport, caring responsibilities, English language proficiency, qualifications and childcare) Chesham High Wycombe Abbey Booker, Cressex & Castlefield Ryemead & Micklefield Terriers & Amersham Hill Totteridge & Bowerdean West Wycombe The majority of data presented within this profile is from the 2021 Census (ONS). Other data sources used are: childcare provider data (Ofsted); claimant count (DWP); business data (Companies House); data on high growth firms (Beauhurst); the Business Register and Employment Survey (ONS) and property data (CoStar). Most data is rounded to the nearest 100. Maps showing the location of each ward can be found here .
Totteridge & Bowerdean ward is located in High Wycombe, to the north-east of the town centre (see maps below). Click here for interactive map
Fast facts 11,900residents 4,300 households 7,900residents of working age (16-64) 450 active companies2 6.8%unemployment rate (March 2021) 0 key employment sites3 365 people claiming unemployment-related benefits (the Claimant Count)1(April 2023) 0 high growth / high growth potential companies4 1,300economically inactive residents of working age (excluding students) 1 DWP, via NOMIS 2 Companies House 3 Bucks LEP 4Beauhurst All data from Census 2021, ONS, unless otherwise stated
Key statistics Totteridge & Bowerdean Buckinghamshire England Ward v Bucks average Rank (of all 49 Buckinghamshire wards) 47th Employment rate (no. of working-age residents in employment / no. of working age residents excluding students) 77% 81% 77% -4 percentage points 3rd Unemployment rate (no. of working-age residents who are unemployed / no. of working age residents who are economically active i.e. employed or unemployed) 6.8% 4.4% 5.8% +2.4 percentage points Claimant count rate1 (no. of claimants / working age population) 3rd 4.8% 2.6% 3.8% +2.2 percentage points 2nd % of working age never worked or long- term unemployed 9% 5% 7% +4 percentage points 6th % of working age employed in routine occupations 10% 8% 11% +2 percentage points 5th % of working age with below Level 2 qualifications 25% 18% 22% +7 percentage points 5th % not in good health 14% 11% 15% +3 percentage points Under 5s per childcare place2 48th * 17 3 4 +14 1 DWP, via NOMIS All data from Census 2021, ONS, unless otherwise stated 2 Ofsted * Out of 48 Buckinghamshire wards (rank not available for Chesham ward)
What the data tells us A lower proportion of the working-age population are in employment than the county average, and a higher proportion are economically inactive. The ward has a younger and much more ethnically diverse population than the county as a whole. The Totteridge & Bowerdean ward is predominantly residential, with few employment sites and few employers. A higher proportion of working-age residents are economically inactive due to looking after home or family than the county and national average. It is estimated that there is less childcare provision within the ward than the county average A high proportion of those who are economically inactive have no qualifications. The ward has the second higher proportion of residents classified as long term unemployed or never worked of all 49 Buckinghamshire wards. A relatively high proportion of working residents travel between 2 and 5km to their place of work. A higher proportion of residents travel by bus, minibus or coach to work than the Buckinghamshire average. .
Issues for exploration Improving connections between local employers and the resident population. Working with employers to understand their recruitment challenges and providing support to help them develop more flexible recruitment approaches to attract and develop pathways into work for lower skilled residents and/or those with complex needs. Targeting of tailored interventions for who are unemployed or economically inactive but would like a job but face specific or multiple barriers. Working with DWP to understand the characteristics and needs of those claiming unemployment related benefits and their ability to access local employment opportunities. Understanding the extent to which bus services are connecting residents to key existing and future employment sites, to ensure routes / timetables are maintained, or are improved. Developing employment sites / attracting new employers Increasing childcare provision to make it easier for parents to work, given that higher proportions of economically inactive residents of working-age are looking after home/family and indications are that childcare provision is relatively scare. Trialling initiatives aimed at those who are long-term unemployed
Local economic context Buckinghamshire s recent economic performance has been broadly on par with the national average, both in terms of economic output (GVA) per head of population and productivity (GVA per hours worked in the local economy) 1. However, the local economy experienced slower-than-average growth over the last two decades and has been more susceptible to adverse economic events (i.e. the great financial crisis of 2008 and the Covid-19 pandemic in 2020/21). Economic growth is important because a growing economy can help facilitate improvements in the economic position of families and individuals, particularly those on low-to-middle incomes. As is the case nationally, the Buckinghamshire economy is dominated by the service sector, and by Small and Medium-sized Enterprises (SMEs). However, Buckinghamshire s SMEs play a more important role in the local economy than nationally, generating 58% of all jobs (compared with 46% nationally) 2. Buckinghamshire has higher levels of self-employment than the national average, although the number of residents classified as self-employed has dropped in recent years 3. For more information about the Buckinghamshire economy, please visit the Buckinghamshire Economic Intelligence Observatory website www.buckseconomy.co.uk 1 Regional gross value added (balanced) by industry: city and enterprise regions and Subregional productivity: labour productivity indices by economic enterprise region, 2023, ONS 2 Inter Departmental Business Register, 2022. ONS 3 Annual Population Survey, Jan Dec 2022, ONS
Structure of the local economy The health, business admin & support, retail and professional, scientific & technical sectors provide the greatest number of jobs in the High Wycombe & Aylesbury area. The latter three being more significant providers of jobs locally than nationally. 0% 2% 4% 6% 8% 10% 12% 14% Totteridge & Bowerdean is situated within the High Wycombe & Aylesbury travel to work area (TTWA)1. This area roughly covers the southern two-thirds of the county of Buckinghamshire. Agriculture, forestry & fishing Mining, quarrying & utilities Manufacturing Construction The health, business admin & support, retail and professional, scientific & technical sectors provide the greatest number of jobs in the High Wycombe & Aylesbury TTWA. The latter three being more significant providers of jobs locally than nationally. Whilst employing fewer people, the wholesale, construction and information & communication sectors are also more significant locally than nationally. The latter includes the film and TV industry, a significant and growing sector with a nucleus at Pinewood Studios. Outside of the county, significant employment areas within commuting distance include London, Slough and Heathrow Airport. Motor trades 6% Wholesale 10% Retail Transport & storage Accommodation & food services Information & communication Financial & insurance Property Professional, scientific & technical 11% Business admin & support services Public admin & defence Education Employment hotspots are shown on the maps on the two following slides. Health Arts, entertainment, recreation High Wycombe & Aylesbury TTWA England 1A travel to work area is a collection of wards for which "of the resident east 75% actually work in the area, and also, that of everyone working in the area, at least 75% actually live in the area". Source: BRES 2021, ONS
Milton Keynes Employment Hotspots Wider area + Luton Hemel Hempstead Areas within commutable distance of Totteridge & Bowerdean where high numbers of jobs are located include: London, Slough, Heathrow and Hemel Hempstead. Oxford Slough Totteridge & Bowerdean Heathrow Click here for an interactive map Source: BRES 2021, ONS
Employment Hotspots Local area + More local areas with high concentrations of jobs are highlighted in the darker colours on this map. They include: central High Wycombe, the Cressex Business Park, Loudwater, Marlow, Chesham, Amersham and Beaconsfield. Totteridge & Bowerdean Click here for an interactive map Source: BRES 2021, ONS
Businesses The highest proportion of businesses in Totteridge & Bowerdean are in the Wholesale & Retail sector Agriculture, Forestry & Fishing In May 2023, approximately 450 active businesses registered with Companies House1 had their head office in the Totteridge & Bowerdean ward. Many will not have employees. Mining & Quarrying Manufacturing Electricity, Gas, Steam & Air Conditioning The largest proportion of businesses located within the ward operate in the wholesale & retail sector (19%), higher than both the Buckinghamshire (13%) and national (14%) averages. Water Supply; Sewerage, Waste 13% Construction 19% Wholesale & Retail Trade; Repair of Motor Transportation & Storage The second highest proportion operate in the construction sector (13%), again, higher than both the Buckinghamshire (10%) and national (11%) averages. Accommodation & Food Service Activities Information & Communication Financial & Insurance Activities Real Estate Activities The ward also has a higher proportion of businesses in the transportation & storage sector than the Buckinghamshire and national averages. Professional, Scientific & Technical Activities Administrative & Support Service Activities Public Administration & Defence; Education The ward has a lower proportion of businesses in the professional, scientific & technical ; manufacturing ; financial & insurance and real estate sectors than the Buckinghamshire and national averages. Human Health & Social Work Activities Arts, Entertainment & Recreation Other Service Activities 0% 5% 10% 15% 20% 1 Companies House data has been used to estimate the number of businesses at ward level, as other sources (such as ONS s Inter-Departmental Business Register) do not provide data for 2022 ward geographies at present. Limitations of Companies House data can be found within the Appendix. Totteridge & Bowerdean Buckinghamshire England Source: Companies House, May 2023
Large employers There are no key employment sites within the ward. Some of the ward s larger employers are listed below: The Highcrest Academy The South Bucks Hospice Kingswood School Hannah Ball School Tesco Profiles of a selection1 of businesses situated within the ward are provided on the following slides. 1See Appendix for details of how these companies were selected
Business profiles South Bucks Hospice offers patient-centred palliative care to individuals. Sector: Social Care Employee size band: Small 10-49 https://sbh.org.uk/ The Highcrest Academy is a secondary school. Sector: Education Employee size band: Medium 50-249 https://highcrestacademy.greenhousecms.co.uk/ Dustbusters Cleaning Sector: Cleaning Employee size band: Small 10-49 https://www.dustbusterscleaning.net/ P.S.B. Builders Domestic and commercial building specialist. Sector: Construction https://www.psbbuildersltd.co.uk/ Source: Beauhurst, 2023
Age Profile Totteridge & Bowerdean has a younger age profile than the county average. 66% At the time of the Census (2021), approximately 11,900 people lived in the Totteridge & Bowerdean ward, of whom 66% (7,900) were of working age, higher than the Buckinghamshire and national averages of 61% and 63% respectively. Totteridge & Bowerdean also had a higher proportion of under 16s but a lower proportion of people aged 65 and over than the county average. 22% 12% Under 16 16-64 65+ Totteridge & Bowerdean Buckinghamshire England Base: 11,500 residents Source: Census, 2021, ONS
Ethnicity A much higher proportion of Totteridge & Bowerdean residents identify as being of Asian, black or mixed ethnicity than the Buckinghamshire and national averages 34% Asian, Asian British or Asian Welsh Totteridge & Bowerdean has a more ethnically diverse population than Buckinghamshire and England as a whole. In 2021, approximately 48% of residents were of Asian, black, mixed or other ethnicity, higher than the county (20%) and national (19%) averages. 6% Black, Black British, Black Welsh, Caribbean or African 5% Mixed or Multiple ethnic groups 34% of Totteridge & Bowerdean residents identified themselves as being of Asian ethnicity, 6% as black and 5% as mixed. 52% White Conversely, a smaller proportion of residents (52%) in Totteridge & Bowerdean identify themselves as being of white ethnicity than the county (80%) and national (81%) averages. 3% Other ethnic group 0% 20% 40% 60% 80% 100% Totteridge & Bowerdean Buckinghamshire England Base: 11,900 residents Note: This data based on individual s perceived ethnic group and cultural background. Source: Census, 2021, ONS
Socio-economic classification A higher proportion of Totteridge & Bowerdean s working-age population usuly work in semi-routine or routine occupations than the county average, and fewer in higher managerial, admin or professional roles. 0% 5% 10% 15% 20% 25% 30% Higher managerial, admin & professional The socio-economic classification profile of Totteridge & Bowerdean residents is broadly similar to the national profile. Lower managerial, admin & professional Intermediate When compared with Buckinghamshire as a whole, a higher proportion of the ward s residents usually work in semi-routine or routine occupations than the county average, and fewer in higher managerial, admin or professional roles. A higher proportion have never worked or are long-term unemployed that the county and national average. Small employers & own account workers Lower supervisory & technical Semi-routine Routine Never worked or long-term unemployed Full-time students Totteridge & Bowerdean Buckinghamshire England Base: 7,900 working-age residents Source: Census, 2021, ONS
Labour market participation Working-age residents of the ward (excluding full-time students) are slightly less likely to be in employment and slightly more likely to be economically inactive or unemployed than the county average. 90% Totteridge & Bowerdean s working-age residents (excluding full- time students) are slightly less likely to be in employment and slightly more likely to be unemployed than the county average. A higher proportion of working-age residents (excluding students) are economically inactive (i.e. not working and not currently seeking work) than the county average. 77% 80% 70% 60% 50% 40% The unemployment rate at the time of the census (the number of people who are unemployed divided by the number who are economically active (i.e. employed or unemployed)) 1 was 6.8%. This was higher than the county (4.4%) and national (5.8%). 30% 19% 20% 10% 5% Please note, this figure differs from the unemployed percentage figure in the chart to the right which shows the proportion of all working-age residents (excluding students) - whether they are economically active or inactive - who are unemployed. 0% In employment Unemployed Inactive Totteridge and Bowerdean Buckinghamshire England Base: 7,150 working-age residents (excluding full-time students) 1 This is the official way of measuring unemployment. Source: Census, 2021, ONS
Labour market participation Working-age residents of Totteridge & Bowerdean (excluding full- time students) who are economically inactive, are much more likely to be looking after home or family than the county and national average. Fewer have taken early retirement. The vast majority of working-age Totteridge & Bowerdean residents (excluding full-time students) who are in employment work as employees. 17% are self-employed, the majority of whom employ no other people. 90% 60% 83% 80% 50% 50% 70% 60% 40% 50% 30% 40% 24% 18% 30% 20% 20% 15% 8% 10% 10% 2% 0% 0% Employee Self-employed with employees Self-employed no employees Long-term sick or disabled Looking after home or family Other Retired Totteridge and Bowerdean Buckinghamshire England Totteridge and Bowerdean Buckinghamshire England Base: 5,500 working-age residents (excluding full-time students) who are in employment Base: 1,300 working-age residents (excluding full-time students) who are economically inactive (i.e. not working and not currently seeking work) Source: Census, 2021, ONS
Unemployed residents by age and sex The ward s unemployed residents are fairly evenly distributed across the four main age bands A higher proportion of the ward s unemployed residents are male than female Female, 43% Male, 57% Base: 360 unemployed residents (excluding full-time students) Source: Census, 2021, ONS
Economically inactive residents of working age by age and sex The ward s economically inactive residents of working age tend to be older, with 4 in 10 being over the age of 50. Few are in the 16 24-year-old age bracket A higher proportion of the ward s economically inactive working age residents are female than male Male, 29% Female, 71% Base: 1,300 economically inactive residents of working age (excluding full-time students) Source: Census, 2021, ONS
Unemployed residents by ethnicity The majority of the ward s unemployed residents are of white or Asian ethnicity 9% 400 8% 350 % of residents within each ethnic 8% group who are unemployed 7% 300 Number unemployed 6% Of the 360 residents classified as unemployed at the time of the 2021 Census, the majority were of white or Asian ethnicity (see columns in the chart to the right). When comparing the unemployed population with the population of the ward as a whole, those who identify themselves as being of mixed or multiple ethnic group ethnicity or a being of black ethnicity are most likely to be unemployed (see dots in the chart to the right). 250 5% 200 4% 150 3% 100 2% 50 1% 0% 0 Asian, Asian British or Asian Welsh Black, Black British, Black Welsh, Caribbean or African Mixed or Multiple ethnic groups White Other ethnic group All Source: Census, 2021, ONS Base: 360 unemployed residents (excluding full-time students) and all residents of working age
Economically inactive residents by ethnicity The majority of economically inactive residents are either of white or Asian ethnicity 25% 1,400 % of residents within each ethnic groups who Of the 1,300 working age residents, excluding full-time students, classified as economically inactive at the time of the 2021 Census, the majority were of Asian or white ethnicity (see columns in the chart to the right). 23% Number economically inactive 1,200 20% 1,000 are economically inactive 15% 800 600 10% When comparing the ethnic profile of the ward s economically inactive population with the ethnic profile of the population of the ward as a whole, those who identify themselves as being of Asian ethnicity are more likely to be economically inactive than those from other ethnic groups (see dots in the chart to the right). 400 5% 200 0% - Asian, Asian British or Asian Welsh Black, Black British, Black Welsh, Caribbean or African Mixed or Multiple ethnic groups Other ethnic group White All Source: Census, 2021, ONS Base: 1,300 economically inactive residents of working age (excluding full-time students)
Unemployed residents by highest level of qualification Just under a third of Totteridge & Bowerdean residents who were unemployed at the time of the 2021 Census had a degree (or higher) level qualification. Just under a third had no or only level 1 / entry level qualifications. 0% 5% 10% 15% 20% 25% 30% 35% No qualifications Just under a third (32%) of Totteridge & Bowerdean residents who were unemployed at the time of the 2021 Census had a degree (or higher) level qualification. Just under a third (31%) had no or level 1 / entry level qualifications. Level 1 and entry level Level 2 qualifications When compared to the qualification levels held by working-age residents (slide 44), those who are unemployed are more likely to have lower-level qualifications. Level 3 qualifications Level 4 qualifications or above Other Base: 360 unemployed residents (excluding full-time students) Source: Census, 2021, ONS
Economically inactive residents by highest level of qualification Just under a third of Totteridge & Bowerdean working-age residents who were economically inactive at the time of the 2021 Census had no qualifications. With a further 16% having low level qualifications (level 1 and below). 0% 5% 10% 15% 20% 25% 30% 35% No qualifications Just under a third (31%) of Totteridge & Bowerdean working- age residents who were economically inactive at the time of the 2021 Census have no qualifications. With a further 16% having low level qualifications (level 1 and below). Level 1 and entry level Level 2 qualifications When compared to the qualification levels held by working-age residents (slide 44), those who are economically inactive are more likely to have no or lower-level qualifications. They are also more likely to have no or lower-level qualifications than those who are unemployed. Level 3 qualifications Level 4 qualifications or above Other Source: Census, 2021, ONS Base: 1,300 economically inactive residents of working age (excluding full-time students)
Unemployed residents by socio-economic classification Over half of the ward s unemployed residents are classified as long- term unemployed or have never worked. 0% 10% 20% 30% 40% 50% 60% Higher managerial, admin & professional occs 3% Lower managerial, admin & professional occs At the time of the 2021 Census, just over half (56%) of Totteridge & Bowerdean s unemployed residents had never worked or were long-term unemployed. This was higher than the county (48%) and national (54%) averages. 9% Intermediate occs 4% Small employers & own account workers 4% 12% usually worked in managerial, admin or professional roles and 20% usually worked in semi-routine or routine operations. Lower supervisory & technical occs 3% Semi-routine occs 9% Routine occs 11% Never worked or long-term unemployed 56% Base: 360 unemployed residents (excluding full-time students) Source: Census, 2021, ONS Note, we are unable to replicate this analysis for economically inactive residents of working age.
Unemployment-related benefit claimants (the Claimant Count) The proportion of Totteridge & Bowerdean residents claiming unemployment-related benefits has been higher than both the Buckinghamshire and national averages over the last five years. In April 2023, 365 Totteridge & Bowerdean residents were claiming unemployment-related benefits. Prior to the onset of the Covid-19 pandemic, the claimant rate1 for Totteridge & Bowerdean was higher than the Buckinghamshire average, and slightly higher than the national average. 9% 7.9% 8% 7% Across all three areas, the claimant rate increased as a result of the Covid-19 pandemic. Between 2019 and 2021, the increase in the claimant rate for Totteridge & Bowerdean outpaced the Buckinghamshire and national average. 6% 5.1% 4.8% 5% 4.3% 4% In April 20212 the claimant count rate in Totteridge & Bowerdean was 7.9%, far higher than the Buckinghamshire average (4.4%) and higher than the national average (6.3%). 2.7% 3% 2% By April 2023, Totteridge & Bowerdean s claimant rate had fallen to 4.8%, but remained higher than the county and national averages. 1% 0% April 2019 April 2020 April 2021 April 2022 April 2023 Totteridge & Bowerdean Buckinghamshire England 1 Unemployment-related benefit claimants as a proportion of all residents aged 16-64 2 Data is presented for the month of April as this is estimated to be the month least affected by job market seasonality Source: Claimant count, 2023, DWP
Unemployment-related benefit claimants by age Claimants from Totteridge & Bowerdean are slightly more likely to be aged 50+ than the county and national averages. 70% 59% 60% Broadly speaking, the age profile of ward residents claiming unemployment-related benefits is very similar to the county and national average. 50% 40% In comparison to the national average, a slightly higher proportion of claimants are older (50+) and a slightly lower proportion are younger (16-24). 27% 30% 20% 14% 10% 0% Aged 16-24 Aged 25-49 Aged 50+ Totteridge & Bowerdean Buckinghamshire England Base: 365 claimants Source: Claimant count, 2023, DWP
Employment by occupation The occupational profile of Totteridge & Bowerdean s employed residents is similar to the national picture. It does vary from the county profile however, with fewer residents employed in managerial, professional and associate professional roles than the Buckinghamshire average. Managers, directors and senior officials In 2021, the largest occupational group of Totteridge & Bowerdean s employed residents was professional . However, a smaller proportion of residents worked in professional roles than the Buckinghamshire average. Professional occupations Associate professional and technical occupations Administrative and secretarial occupations The second largest occupational group in Totteridge & Bowerdean was associate professional & technical , but again with a slightly smaller proportion of residents than the Buckinghamshire average. Skilled trades occupations Caring, leisure and other service occupations Sales and customer service occupations A smaller proportion of residents work in managerial roles than the county average and a greater proportion of residents work in lower level occupations. Process, plant and machine operatives Elementary occupations 0% 5% 10% 15% 20% 25% Totteridge & Bowerdean Buckinghamshire England Base: 5,800 residents over the age of 16 and in employment Source: Census, 2021, ONS
Employment by industry A higher proportion of Totteridge & Bowerdean residents work in the wholesale & retail; health & social care; admin & support services; transport & storage; and accommodation & food industries than the Buckinghamshire average Agriculture, Forestry & fishing Mining & quarrying Manufacturing The two largest industry groups in which ward residents work are wholesale & retail and health and social care . Totteridge and Bowerdean residents are more likely to work in both of these sectors than the county average. Electricity, gas, steam & air conditioning supply Water supply; Sewerage, Waste management & Construction Wholesale & retail trade; repair of motor vehicles & Transport & storage Accommodation & food service activities Residents are also more likely to work in the transport & storage , hospitality and admin & support sectors than the county average. They are less likely to work in the knowledge economy sectors of information & communication , professional, scientific & technical and financial & insurance . Information & communication Financial & insurance activities Real estate activities Professional, scientific & technical activities Admin & support service activities Public admin & defence; compulsory social security Education Human health & social work activities Other 0% 2% 4% 6% 8% 10% 12% 14% 16% 18% % residents aged 16+ in employment Totteridge & Bowerdean Buckinghamshire England Base: 5,800 residents over the age of 16 and in employment Source: Census, 2021, ONS
Public and private sector employment A lower proportion of Totteridge & Bowerdean residents are estimated to work in the public sector than the Buckinghamshire and national average. As is the case at the county and national level, residents of Totteridge & Bowerdean are estimated* to be more likely to be employed in the private sector than in the public sector. Totteridge & Bowerdean 27% 73% In 2021, 27% of Totteridge & Bowerdean employed residents were estimated to be working in the public sector. This was slightly lower than the Buckinghamshire (28%) and national (30%) average. Buckinghamshire 28% 72% England 30% 70% 0% 20% 40% 60% 80% 100% Public sector Private sector *Data shown are estimates and should be treated with caution. Public sector employment has been calculated using data for the public administration and defence; compulsory social security ; education ; and human health & social work activities SIC sectors. As these sectors are broad, data will include some private sector employment. Base: 5,800 residents over the age of 16 and in employment Source: Census, 2021, ONS
Totteridge & Bowerdean residents employed by Buckinghamshire NHS % of residents working in Bucks Educational level requirement Band Ward residents NHS Pay range s 27 Band 2 22,383 None 27% In total, approximately 100 ward residents are employed by Buckinghamshire NHS, just over a quarter of whom are employed on the lowest pay scale. Just under half of all residents working for the NHS are doing so in graduate- level or above positions. 13 Band 3 22,816- 24,336 NVQ L3 13% 15 Band 4 25,147- 27,596 Foundation degree 15% 17 Band 5 28,407- 34,581 Graduate 17% 16 Band 6 35,392- 42,618 Graduate 16% 11 Band 7 or above Above 43,742 29,384 - 119,133 Masters or equivalent 11% < 10 Medical staff Total (excluding medical staff) Post graduate + n/a 99 100% Source: Bucks NHS (May 2023)
Home working A lower proportion of Totteridge & Bowerdean residents work from home than the Buckinghamshire average. 45% In 2021, 30% of Totteridge & Bowerdean s employed residents worked mainly at or from home. This was lower than the Buckinghamshire (42%) and national (32%) average. 40% 35% 30% 25% Please note that as the 2021 Census took place in March 2021, during a period of rapid change stemming from Covid-19, this data should be treated with caution in terms of future planning. 20% 15% 10% 5% 0% Work mainly at or from home Totteridge and Bowerdean Buckinghamshire England Base: 5,800 residents over the age of 16 and in employment Source: Census, 2021, ONS
Distance travelled to work A much higher proportion of Totteridge & Bowerdean residents aged 16 and over and in employment travelled 2 to 5km to work than the Buckinghamshire and national average. In 2021, almost a third (29%) of Totteridge & Bowerdean residents in employment1travelled 2 to 5km to their place of work. This was much higher than the Buckinghamshire (17%) and national (23%) average. 35% 29% 30% 25% A higher proportion of residents in Totteridge & Bowerdean and Buckinghamshire travelled 30km and over to their place of work than the national average. This is likely primarily due to Buckinghamshire s close proximity to employment hotspots outside of the county, such as London and Heathrow airport. 20% 15% 10% 5% In 2011 (latest available data) Buckinghamshire had one of the least self-contained labour markets in England. With around a third of working residents travelling out of the county for work, and 28% of all those working within the Buckinghamshire economy travelling into the county from elsewhere. 0% Totteridge and Bowerdean Buckinghamshire England 1 This chart excludes those who work mainly or at home, or work mainly at an offshore installation, in no fixed place, or outside the UK. Base: 3,100 residents over the age of 16 and in employment who travel to work Source: Census, 2021, ONS
Method of travel to work In 2021, of the Totteridge & Bowerdean residents who travel to their place of work, just over three quarters (78%) travelled by car or van. This was lower than the Buckinghamshire average (80%), but higher than the national average (71%). A higher proportion of Totteridge & Bowerdean residents travel by bus, minibus or coach to work than the Buckinghamshire average. Train Bus, minibus or coach Taxi Of those who travel to work, a lower proportion of Totteridge & Bowerdean residents travelled by car or van than the Buckinghamshire average. Motorcycle, scooter or moped Bicycle On foot Other 71% 80% 78% 0% 2% 4% 6% 8% 10% 12% Totteridge and Bowerdean Buckinghamshire England Totteridge & Bowerdean Buckinghamshire England Looking in more detail at those not travelling by car or van, 8% travel by foot (lower than the county and national averages), and 5% by bus, minibus or coach (slightly lower than the national average but higher than the Buckinghamshire average). Base: 3,100 residents over the age of 16 and in employment who travel to work Source: Census, 2021, ONS
Section 3: Barriers to employment
In this section we present data for some potential barriers to sustained employment. These are: Health status English language proficiency Access to childcare provision Providing unpaid care Access to a car or van Highest level of qualifications There will be additional factors that could be hindering residents ability to access sustained employment.
Health status English language proficiency Based on responses to the 2021 Census, 14% of those of working-age living in the Totteridge & Bowerdean ward are deemed to be not in good health . Overall, 3.1% of Totteridge & Bowerdean s working-age residents cannot speak English well or at all. This is higher than the Buckinghamshire (1.2%) and national (2.1%) average and equates to approximately 250 people. This was a higher proportion than the county average (11%) but lower than the national average (15%) and equates to approximately 1,100 people. 0.0% 0.5% 1.0% 1.5% 2.0% 2.5% 3.0% 3.5% Totteridge and Bowerdean 3.1% 15% 11% 14% Buckinghamshire Totteridge & Bowerdean Buckinghamshire England England Base: 7,900 working-age residents Base: 7,900 working-age residents Source: Census, 2021, ONS
Childcare Provision Total number of childcare places offered is approximately equivalent to: In 2022, Totteridge & Bowerdean had 2 childcare providers registered on the Early Years Register (EYR)1, offering 56 places at the point of registration2. 19 childcare providers are located in wards that neighbour Totteridge & Bowerdean, offering a total of 663 places at the point of registration. 39%* 24% 6% The proportion of childcare places offered within the ward compared to the total population of Totteridge & Bowerdean residents aged 5 and under is equivalent to 6%, lower than the 39% Buckinghamshire average3. The proportion for Totteridge & Bowerdean is also lower than the 24% average across the 10 Opportunity Bucks wards where people are experiencing the most hardship. Totteridge & Bowerdean Opportunity Bucks wards Buckinghamshire of the total number of residents aged 5 and under. Alternatively, there are an average of 17 residents aged 5 and under for each childcare place offered in Totteridge & Bowerdean. This is considerably higher than the average across Opportunity Bucks wards and the average for Buckinghamshire. Or approximately 1Ofsted Early Years Register data on childcare provider places covers all places for children up to the 31st August following their fifth birthday. Place numbers mentioned are actual place numbers where recorded, and not estimated place numbers. 17 3 4 2 This analysis should be treated with caution as childcare provider data only includes those where a local authority location has been provided. Childminders in particular are likely to withhold the sharing of postcode data. 3 *Approximately 14% of childcare places in Buckinghamshire cannot be assigned to a ward as the provider has redacted their postcode. In order to provide a comparison between wards and county, figures for Buckinghamshire (county) do not include postcode redacting providers. If included, the proportion of childcare places offered in the county would be approximately equivalent to 45% of residents aged 5 and under. residents aged 5 and under per childcare place offered. EYR places are available to children aged up to the 31st August following their fifth birthday. The number of residents aged 5 are aged up to 31st December following their fifth birthday. Source: Ofsted, 2022, Childcare provider level data, Dataset 1
Provision of unpaid care Totteridge & Bowerdean s working-age residents are slightly less likely to be providing unpaid care than the county and national averages Totteridge & Bowerdean 8.8% In 2021, approximately 690 Totteridge & Bowerdean residents of working age were providing unpaid care1. This equated to 8.8% of the working age population, lower than the county (9.2%) and national (9.9%) averages. Buckinghamshire England 0.0% 2.0% 4.0% 6.0% 8.0% 10.0% 12.0% Base: 7,900 working-age residents 1 An unpaid carer may look after, give help or support to anyone who has long-term physical or mental ill-health conditions, illness or problems related to old age. This does not include any activities as part of paid employment. This help can be within or outside of the carer's household Source: Census, 2021, ONS
Access to car or van A higher proportion of Totteridge & Bowerdean households did not have access to a car or van than the Buckinghamshire average. 50% In 2021, a higher proportion of Totteridge & Bowerdean households did not have access to a car or van (15%) than the Buckinghamshire average (11%). However, this was lower than the national average of 24%. 42% 40% 31% 30% 42% of households in Totteridge & Bowerdean had access to 1 car or van. This was higher than both the Buckinghamshire (37%) and national (41%) average. 20% 15% The proportion of Totteridge & Bowerdean households with access to 2 or more cars or vans (421%) was lower than the Buckinghamshire average (51%), but was higher than the national average (35%). 11% 10% 0% No cars or vans 1 car or van 2 cars or vans 3 or more cars or vans Totteridge and Bowerdean Buckinghamshire England Base: 4,400 households Source: Census, 2021, ONS
Highest level of qualifications A higher proportion of Totteridge & Bowerdean residents have no or only low (level 1 & entry) level qualifications than the county and national average. 50% 45% In 2021, 37% of Totteridge & Bowerdean s working-age population had a Level 4 or higher qualification (see chart). The majority will be degree holders. This was 7 percentage points lower than the Buckinghamshire average, but was similar to the national average. A similar proportion to county and national averages were qualified to Levels 2 and 3. 37% 40% 35% 30% 25% 20% 14% 15% 12% 10% A higher proportion had no qualifications (14%) compared to the Buckinghamshire average (9%) however, the proportion was slightly higher than the national average (12%). 5% 0% Level Description Level 1 Fewer than 5+ GCSEs / NVQ 1 Level 2 5+ GCSEs / NVQ 2 or equivalent Totteridge & Bowerdean Buckinghamshire England Level 3 2+ A-levels / NVQ 3 or equivalent Base: 7,900 working-age residents Level 4+ HNC, HND, NVQ 4 and 5, degree or higher Other Includes Apprenticeships, vocational quals and quals obtained overseas Source: Census, 2021, ONS
Glossary Term Definition Unpaid care An unpaid carer may look after, give help or support to anyone who has long-term physical or mental ill-health conditions, illness or problems related to old age. This does not include any activities as part of paid employment. This help can be within or outside of the carer's household. Claimants People claiming Jobseeker's Allowance plus those who claim Universal Credit who are out of work. Economically active Those in employment plus those that are unemployed. Those that are unemployed are deemed economically active as they are seeking work and willing and able to accept a job. For further details see the economic activity diagram here. Economically inactive Those not in employment and have not been seeking work within recent weeks. Semi-skilled and blue- collar occupations Production and maintenance roles High growth companies Has met one of Beauhurst s tracking triggers including: secured equity investment; secured venture debt; underwent a management buyout or buy-in; attended a selected accelerator programme; has been or is a scale-up; spun out of an academic institution; was featured in a selected high-growth list; accepted a large innovation grant Key employment sites A business park, retail park or industrial estate.
Data limitations Data source Limitations Companies House Data is sourced from the information that companies submit to Companies House. Submitted data is not checked or verified by Companies House. This includes SIC codes, which are chosen by a company to designate which industry they are active in. A company is expected to choose an appropriate SIC code, however it may not accurately reflect their business activities. A company can also be both active and classified as a dormant company not trading under SIC code 9999 (dormant companies have been removed from analysis in this resource). Companies House figures are also likely to be overestimated as a single parent trading company can register multiple subsidiaries. A company can also be added to the register before it begins trading. Claimant Count The claimant count is a proxy measure for unemployment. It is useful because it is produced at a granular geographic level (e.g. ward level) and is timely (produced monthly). When using claimant count data be aware that not all those who are unemployed will claim unemployment-related benefits. And not all claimants are unemployed. Some will be working but on low incomes / few hours and therefore will be entitled to claim unemployment-related benefits. Estimates of public and private sector employment Data shown are estimates and should be treated with caution. Public sector employment has been calculated using data for the public administration and defence; compulsory social security ; education ; and human health & social work activities Standard Industrial Classification (SIC) code sectors. As these sectors are broad, data will include some private sector employment.
Other information Data source Information Business profiles Businesses selected are mainly those with the highest level of turnover and/or the highest number of employees. The employee size band refers to the company-wide workforce, therefore not all jobs will be Buckinghamshire-based. In addition, some profiles of other typical businesses in an area have been profiles, along with some businesses operating within the county s strategic growth sectors.
