Economic Impacts of Climate Change in Uganda: Sector Studies and Case Studies
Addressing the economic impacts of climate change in Uganda, this study delves into four main components including downscaling of climate change scenarios, economic modeling at national and sectoral levels, policy recommendations, and communication strategies. With a focus on sectors such as water, agriculture, infrastructure, and energy, the study aims to assess past impacts, analyze the structure of the water sector, detail the methodology used, and highlight the expected water demand in 2030 based on renewable water resources.
Download Presentation

Please find below an Image/Link to download the presentation.
The content on the website is provided AS IS for your information and personal use only. It may not be sold, licensed, or shared on other websites without obtaining consent from the author.If you encounter any issues during the download, it is possible that the publisher has removed the file from their server.
You are allowed to download the files provided on this website for personal or commercial use, subject to the condition that they are used lawfully. All files are the property of their respective owners.
The content on the website is provided AS IS for your information and personal use only. It may not be sold, licensed, or shared on other websites without obtaining consent from the author.
E N D
Presentation Transcript
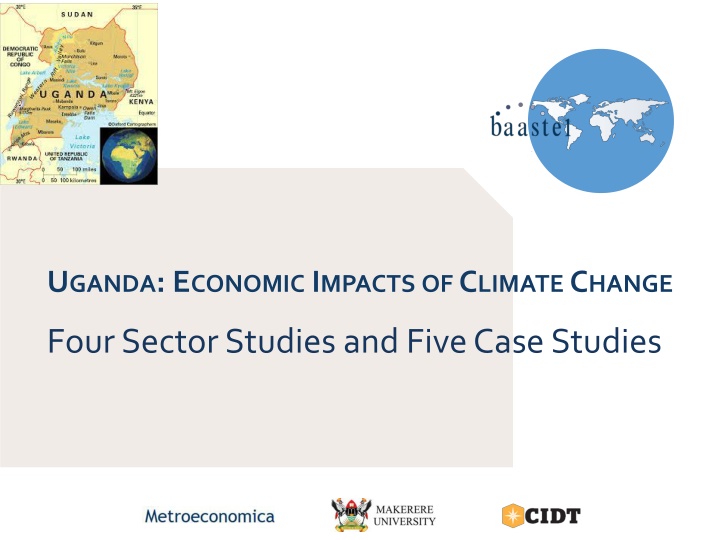
UGANDA: ECONOMIC IMPACTS OFCLIMATECHANGE Four Sector Studies and Five Case Studies
INTRODUCTION Study commissioned by the Uganda s Ministry of Water and Environment s Climate Change Department Funded by CDKN and DFID Started in January 2014, and will be finalised in June 2015 4 main components: Downscaling of climate change scenarios over Uganda Economic modelling at national/sectoral and district levels through case-studies Recommendations for policy development and implementation, and priority investments Communications & outreach 02/10/2024 2
SECTOR ANDCASE STUDIES Sectors looked at are: water, agriculture, infrastructure and energy. We have drafts of these Case studies under way are: urban areas (Kampala), coffee region (Mt. Elgon), agriculture and livestock region (Karamoja), water and energy conflict region (Mpanga) and a case study of regions where health impacts of climate change could be important. Some preliminary results are available for Kampala
The Water Sector 4 02/10/2024 4
PAST IMPACTSAND STRUCTUREOFTHEANALYSIS Climate change and variability are already affecting the availability of water in Uganda. Recent extreme events such as the La Nina drought of 1998-2000 and floods, including the ENSO 1997-1998 event, have caused significant losses. This study has assessed: The impacts of climatic and socio-economic changes on water supply and demand; The size of economic losses due to unmet demand in money terms; The costs of water shortage due to extreme events 02/10/2024 5
CLIMATECHANGEIMPACTS Changes in Internal Renewable Water Resources for Uganda (RCP8.5 -SSP5). Source: Water2Invest. Current 2050 613 497 686 1,692 1,019 653 558 553 675 964 1,002 774 9,686 Change (%) Jan Feb Mar Apr May Jun Jul Aug Sep Oct Nov Dec Sum 771 694 -20.4 -28.4 -39.8 -43.1 -37.7 -49.2 -22.1 -15.6 12.2 13.2 3.8 -7.3 -26.2 1,139 2,976 1,636 1,285 717 655 601 852 965 835 13,127
EXPECTED DEMAND IN2030 BY BASIN Notes: IRWR = Internal renewable water resources, EI = exploitation index (= demand/IRWR)*100.
EXPECTED DEMAND IN2050 BY BASIN 2050 Urban Rural Watershed Lake Victoria Lake Kyoga Victoria Nile Lake Edward Lake Albert Aswa Albert Nile Kidepo Misc Total Domestic 213.8 Domestic 140.0 231.5 Industrial Livestock 28.9 1.3 0.8 0.9 0.4 0.0 0.3 0.0 0.0 32.6 Irrigation 453.1 1344.9 218.0 133.8 Total 878.1 1750.2 357.3 267.1 68.3 139.3 534.8 10.3 24.8 4030.2 IWRW 1680.0 2320.0 1440.0 4470.0 2890.0 1770.0 450.0 210.0 360.0 15590 EI 42.3 75.7 23.2 18.1 12.5 14.2 15.6 2.6 8.2 212.4 52.1 75.5 24.8 6.0 2.3 7.9 118.6 3.6 6.9 14.3 96.8 41.4 33.6 11.6 30.4 31.1 0.0 5.2 463.9 73.9 80.7 43.8 2.7 59.8 5.1 11.4 648.9 0.0 52.0 428.0 0.0 0.0 2629.8 Notes: IRWR = Internal renewable water resources, EI = exploitation index (= demand/IRWR)*100.
ALLOCATION RULE FORWATER For the purposes of this study, based on discussions with the Ministry of Water and Environment, we assume a hierarchy of allocation, with the following demands being met sequentially: 1. Consumption demand urban and rural; 2. Irrigation water demand; 3. Industry water demand; and 4. Livestock consumption demand.
UNMET DEMAND BY USERAND BY BASIN IN2050 Domestic Irrigation Industry Livestock Lake Victoria 97,788.1 360,057.3 28,900.0 42,300.0 Lake Kyoga 0.0 127,868.7 433.3 26,477.9 Victoria Nile 0.0 12,286.5 200.0 6,839.4 Lake Edward 0.0 0.0 0.0 1,298.5 Lake Albert 0.0 0.0 0.0 1,078.1 Aswa 1,613.3 28,160.6 0.0 13,848.0 Albert Nile 0.0 179,593.3 300.0 15,600.0 Kidepo 129.3 0.0 0.0 857.2
VALUATIONOF UNMET DEMAND Willingness to pay (shillings/litre, 2013 prices) User category Source Urban domestic 17.97 Based on Whittington et al (1998), updated for inflation Rural domestic 15.08 Based on Wright (2012), updated for inflation Industry 17.18 Based on Davis et al (2001), updated for inflation Irrigation 15.15 Based on Angella et al (2014), updated for inflation Livestock 15.15 Based on irrigation
ESTIMATEDECONOMIC LOSSES DUETOWATER SHORTAGES IN 2050 UNDERCLIMATECHANGE (BILLIONSOF SHILLINGS) Domestic Irrigation Industry Livestock Total Lake Victoria 1,645.6 5,456.0 496.6 641.0 8,239.3 Lake Kyoga 0.0 1,937.6 7.4 401.2 2,346.3 Victoria Nile 0.0 186.2 3.4 103.6 293.3 Lake Edward 0.0 0.0 0.0 19.7 19.7 Lake Albert 0.0 0.0 0.0 16.3 16.3 Aswa 28.6 426.7 0.0 209.8 665.2 Albert Nile 0.0 2,721.4 5.2 236.4 2,963.0 Kidepo 1.9 0.0 0.0 13.0 14.9 Total 1676.1 10,728.0 512.7 1,641.1 14,558.0 Overall we estimate 14,558 billion shillings ($5.5 billion) due to water shortages.
COSTS OF DROUGHTS IN UGANDA Summary of damage and losses caused by the 2010-2011 rainfall deficit Sector Damage Production losses Higher costs Total Crops 1034.7 1034.7 Livestock 106.2 934.9 85.4 1126.5 Agro Industry 278 278 Commerce 39.2 130.7 169.9 Electricity 106.3 106.3 Water 0.6 1.3 1.9 Health 14.9 14.9 Education 48.6 48.6 Food Aid 16.9 16.9 Total (Bn Shs) 106.2 2287.3 404.1 2797.6 Total (million US$) 44.6 959.9 169.6 1174.1
NET BENEFITSOF DIFFERENTADAPTATIONOPTIONS Present Value of Costs @ 10% Discount Rate ($Mn.) Minimum % Reduction in Damage to give a 10% Return Impact of Programme that has been assessed Programme Efficient water utilisation among households $4.7 Reduced unmet demand in household sector 0.51% Increased water availability for agriculture and industry $32.7 Reduced unmet demand in agriculture, livestock and industry 0.4% Integrated water resource management to deal with extreme events $42.8 Reduced damages from future droughts 4.5%
SUMMARY Climate and socioeconomic change will lead to deficits in water supply without adaptation. A conservative estimate puts losses at US$5.5 billion by 2050, and it could be as high as $50.2 billion if income elasticity is taken into account. Extreme weather events give an indication of the potential costs of climate change and there have been significant economic costs associated with such events. For example, the 2010-11 drought cost Uganda $1.1 billion. Adaptation of the water sector, taking into account the needs to adapt to climate change and socioeconomic development, is likely to yield significant welfare gains.
The Agriculture Sector 17 02/10/2024 17
BACKGROUND The agricultural sector is a fundamental part of the Ugandan economy, employing about 66 percent of the working population in 2009/10 and contributing about 22 percent to total GDP in the year 2012. The study assessed: Potential economic impacts of climate change on: (i) food crops (ii) livestock and (iii) export crops. Current and future economic impacts of droughts and floods on agriculture. Adaptation priorities http://ag4impact.files.wordpress.com/2012/01/p1030160.jpg?w=244h=184
FOOD CROPS Study estimated changes to future production and value of food crops due to climate change impacts on yield and cultivation area. Results for production and value changes show great divergence between different climate models and different regions for 11 crops. Most crops show reductions in total production under almost all climate change scenarios to 2050 (e.g. cassava, maize, millet, groundnuts); but some show both increases and decreases depending on the model (e.g. maize). For some crops the impacts are quite significant (e.g. cassava, potato and sweet potato show around 40% reductions). In other cases, reduction is less than 10% (e.g. millet, sorghum and pigeon peas). Largest impacts in the East and North. Overall losses for food crops by 2050 are likely to be up to US$1.5 billion. Under assumed growth this is less than 0.2 percent of GDP in that year.
FOOD CROP PRODUCTIONWITHCLIMATECHANGEAS % OF PRODUCTIONWITHOUTCLIMATECHANGE IN 2050 120 100 80 60 Pessimistic Baseline 40 Optimistic 20 0 CSIRO A1B CSIRO A1B CSIRO A1B CSIRO A1B CSIRO A1B CSIRO A1B CSIRO A1B CSIRO A1B CSIRO A1B CSIRO A1B CSIRO A1B CSIRO B1 CSIRO B1 CSIRO B1 CSIRO B1 CSIRO B1 CSIRO B1 CSIRO B1 CSIRO B1 CSIRO B1 CSIRO B1 CSIRO B1 MIROC B1 MIROC B1 MIROC B1 MIROC B1 MIROC B1 MIROC B1 MIROC B1 MIROC B1 MIROC B1 MIROC B1 MIROC B1 MIROC A1B MIROC A1B MIROC A1B MIROC A1B MIROC A1B MIROC A1B MIROC A1B MIROC A1B MIROC A1B MIROC A1B MIROC A1B Cassava Gdnuts Maize Millet Pg Peas Potato Rice Sorghum Soybean Sugar cane Sweet Pot
FOODCROPSVALUE CHANGE DUETOCLIMATECHANGE COMPARED WITH NOCLIMATECHANGE IN 2050 (USD 1000 AT 2000 PRICES) 1500000 1000000 500000 0 -500000 Pessimistic Baseline -1000000 Optimistic -1500000 -2000000 CSIRO A1B CSIRO A1B CSIRO A1B CSIRO A1B CSIRO A1B CSIRO A1B CSIRO A1B CSIRO A1B CSIRO A1B CSIRO A1B CSIRO A1B CSIRO B1 CSIRO B1 CSIRO B1 CSIRO B1 CSIRO B1 CSIRO B1 CSIRO B1 CSIRO B1 CSIRO B1 CSIRO B1 CSIRO B1 MIROC B1 MIROC B1 MIROC B1 MIROC B1 MIROC B1 MIROC B1 MIROC B1 MIROC B1 MIROC B1 MIROC B1 MIROC B1 MIROC A1B MIROC A1B MIROC A1B MIROC A1B MIROC A1B MIROC A1B MIROC A1B MIROC A1B MIROC A1B MIROC A1B MIROC A1B Cassava Gdnuts Maize Millet Pg Peas Potato Rice Sorghum Soybean Sugar cane Sweet Pot
ESTIMATEDIMPACTS: LIVESTOCKPRODUCTS Impacts of climate change scenarios on livestock production were estimated for Beef, Lamb, Pork, Poultry, Eggs, Poultry and Milk. In all cases impacts were quite small (1 or 2 percent). This modeling was only for yield and area whereas the key impacts on livestock may come from other climate change factors, in particular droughts, floods and diseases.
ESTIMATEDIMPACTS: AGRICULTURALEXPORTS Agricultural exports represented about 50% of the total export value of Uganda in 2013. Coffee production (18% of total exports) is a key area of concern under climate change. Significant negative impacts on Arabica coffee growing areas due to climate change are forecast. Estimates for Robusta are less well developed but preliminary studies show impacts Illustrative estimate of value of potential losses of Arabica and Robusta coffee combined: about US$1,235mn. in 2050 (50 percent reduction in production).
PREDICTED SUITABILITY FOR COFFEE PRODUCTION INARABICA COFFEE-PRODUCINGAREA IN UGANDA (CURRENT, 2030, AND 2050).
ESTIMATED IMPACTS: AGRICULTURAL EXPORTS Estimates of impacts on tea growing areas (over 3% of total export revenues for Uganda) also indicate significant losses of value under climate change scenarios. Some potential losses of cotton production (also over 3% of total export revenues for Uganda) are projected. These results indicate the potential for Uganda agricultural export production and value to be strongly affected by climate change in the absence of adaptation actions. Estimated value of losses due to a 50 percent reduction in production of coffee and tea combined would be about US$1,400 million in 2050.
ESTIMATED IMPACTS: EXTREMEWEATHER EVENTS For some agricultural products the threat from droughts and floods are greater than the threat from decreased yields. Extreme weather events have been increasing and becoming more severe in recent years in Uganda. Divergence in estimates of magnitude of current losses. o Estimated loss of about US$470 million to food crops, cash crops and livestock from the 2010-11 drought (OPM, 2012). o This equates to about 16% of total value of these items in GDP for 2011. o Annual damage figure of US$47million to crops from the 2008 drought (NEMA, 2008) is equal to approximately 3 per cent of the value of all cash and food crops.
ADAPTATION PRIORITIES The immediate priority for adaptation action is the threat from droughts and floods. Agricultural export production of coffee and tea would be strongly affected by climate change without adaptation. Threats also exist to some food crops (e.g. cassava, potato and sweet potato) due to changes in yield and cultivation areas. Largest impacts on food crop production are estimated in the East and North of Uganda. Increased risks from the above threats are greater in areas of existing poverty and, without adaptation, will have serious consequences for local economies and food security.
ADAPTATION PRIORITIES Government of Uganda has identified eight areas of adaptation for the agricultural sector, with a proposed budget over the next 15 years of about US$297 million: 1. Promote highly adaptive & productive crop varieties and cultivars in drought- prone, flood-prone and rain-fed farming systems. 2. Promote highly adaptive and productive livestock breeds. 3. Promote conservation agriculture and ecologically compatible cropping systems. 4. Promote sustainable management of rangelands and pastures 5. Promote irrigated agriculture by encouraging irrigation systems that use water sustainably. 6. Promote agricultural diversification and improved post-harvest handling, storage and value addition. 7. Support community-based adaptation strategies through expanded extension services and improved climate information systems. 8. Develop innovative insurance schemes (low-premium micro-insurance policies) and low-interest credit facilities.
Infrastructure 29 02/10/2024 29
MAIN ISSUES Uganda s infrastructure is currently subject to major impacts from climate variability: this is not a problem only for the future but very much something that urgently needs to be addressed today. We estimate : The costs of making the country s infrastructure more resilient in the face of increased climate stress such as increased rainfall and changes in temperature; and The cost of damage to infrastructure from extreme events.
MAKING INFRASTRUCTURECLIMATE RESILIENT Infrastructure comprises residential buildings, non- residential private buildings, social infrastructure (including schools, hospitals, ports, airports, government offices) and roads, railways and bridges. Total annual costs for ensuring climate resilient infrastructure in Uganda are estimated at US$52-66 million for the period 2015-2020; and US$638-1,157 million for the period 2045-2050. New construction accounts for around 37% per cent of total costs; the rest is additional maintenance.
MAKING INFRASTRUCTURECLIMATE RESILIENT Costs depend on which climate scenario we take, especially later on. Total costs to 2050 could be 50% higher if the RCP8.5 scenario is realized compared to the RCP 4.5 scenario. The most affected sector is residential buildings, which accounts for around half of all costs. Next are public buildings, which account for a quarter and then comes other private non-residential infrastructure with 16%. In fact it is buildings that account for most of the costs (92%). Transport only accounts for 8%.
EXTREME EVENTS Damages from flooding are already significant. If there is no increase in frequency or intensity to 2050 then the damages, currently between $20-130 million a year (depending on how you value the loss of life), rise to $39-234 million by 2025 and to $189-838 million by 2050. Some increase in frequency can be expected though we don t know how much. Assuming a doubling of frequency every 25 years would result in damages of around $77-467 million by 2025 and $738-3294 million by 2050.
ADAPTATION PRIORITIES Highest priorities in the infrastructure adaptation programme are for climate proofing public buildings, developing standards for transport and infrastructure planning and climate change-resilient standards into existing infrastructure risk assessment guidelines. The projected adaptation program for disaster risk reduction is only a fraction of the damages estimated from disasters. Hence if the programmes can reduce damages by even a small amount (i.e. around 7%) they will, under the most conservative assumptions, generate a rate of return of at least 10 percent.
Energy 35 02/10/2024 35
MAIN ISSUES Energy use in Uganda is dominated by traditional biomass, with electricity and other fuels playing a very small role. With the exception of transport, biomass is the main energy resource not only for household but all the other sectors. Electricity access in Uganda is about 15 percent and it constitutes about 1.4 percent of the total energy. The present situation is one where demand and supply for each type of energy is in a precarious balance. For biomass supply is being met in an unsustainable way through deforestation. Uganda has a total of 3.6 million hectares of forest land. The total deforestation rate per year is 1.8%. Although deforestation has been declining, studies indicate that with growing biomass demand and constant rates of deforestation there will be a deficit of around 16 percent by 2016.
PROJECTIONSWITHOUTCLIMATECHANGE If no action is taken there will be a huge deficit of biomass (1,710 million tonnes) over the period 2010-2050. This is not sustainable, so we consider an alternative where biomass demand is much lower and is replaced by LPG, greater efficiency in biomass and greater use of electricity. With this alternative scenario the biomass demand can be met but there is a deficit in electricity based on current generation plans of 9%. One way to reduce this deficit could be to import biomass or import electricity.
IMPACTS OF CLIMATECHANGE When climate change impacts on the energy sector are evaluated, two things stand out. The first is that such change will almost certainly reduce biomass availability. We estimate that a plausible loss of 5 to 10 percent of domestic wood between 2020 and 2050 would imply the need for additional expenditures of $5-11 billion on LPG to meet demand.
IMPACTS OF CLIMATECHANGE The second main impact of climate change is on availability of water for hydropower generation. There is a possibility that hydropower potential will decrease due to a reduction in precipitation. A possible decline of 26 percent by 2050 has been estimated in the water sector study. Under that scenario, the government s current expansion programme for the power sector is sufficient to cover the hydropower deficit, as long as the other components of the programme are implemented according to the proposed schedule.
POWER GENERATION EXPANSION PLAN A very ambitious programme, which will demand large financial resources as well as highly skilled manpower. The estimated additional capital investment in hydro, nuclear and other generation from now to 2050 is around $83 billion. In the period 2015-2020 the country will need to invest around one billion dollars in the electricity system, or around $200 million per year, which is equal to about one percent of national GDP. In future years the amounts increase very sharply.
INSTALLED(HISTORICAL2010-13) AND PROJECTED (UPTO 2050) ELECTRICITYCAPACITY
ADAPTATION The Government s Adaptation Strategy focusses heavily on reducing dependence on biomass, but it also gives importance to promoting energy conservation and efficient utilisation of energy to reduce GHG emissions. It does not have much on increased use of LPG or expanding access for electricity. The government programmes aiming to increase energy efficiency are similar to those in many developing countries. Reviews of such programmes indicate a high level of cost effectiveness in promoting energy efficiency and reducing GHG emissions.
ADAPTATION The main difficulties arise when the program requires an up-front expenditure by users with limited resources. In Uganda similar considerations will apply: energy efficiency programmes designed with care, taking account of lessons learnt from other countries in a similar situation, should yield high benefits relative to costs. Detailed estimates of the benefits and costs of individual components in the adaptation programme require more data. Hence they will have to wait for case studies to be undertaken in the future.
KAMPALA CASE STUDY PRELIMINARY RESULTS
MAIN ISSUES A crucial demographic, social, economic and political pole in East Africa, the city faces problems from climate variability and climate change with respect to flooding, water supply, infrastructure resilience. Local climate scenarios developed for the city and used to assess the effects in these areas. The urban poor suffer most the impacts of climate change. Informal settlements, 60% of Kampala s population (about 700.000 people), especially in wetlands, are particularly hit, especially from flooding The shallowness and low topographic gradients of Lake Victoria make it particularly sensitive to changes in water levels, and temperatures favour vector-borne diseases.
MAIN FINDINGS The damages from extreme events leading to flooding could rise from between $1.3 and $7.3 million in 2013 to between $3.7 and $17.6 million by 2025 and between $33.2 million and $101.7 million by 2050, if the frequency and intensity of these events does not change Damgeswould be between $5.6 and $26.3 million by 2025 and between $66.5 and $203.3 million by 2050 if the frequency of these events doubles and increases linearly between 2013 and 2050. Cost of climate proofing buildings and roads are significant: between $3,259 million (under RCP4.5) and $3,699 million (under RCP8.5) over the 2015-2050 period, between $560 million (under RCP4.5) and $600 million (under RCP8.5) only over the period 2015-2030
MAIN FINDINGS Cost benefit analysis of proposed 4 flood schemes indicates a high net benefits for two of them even with no climate change. The other two have a positive net benefit if frequency of flooding rises, as is possible. More work on local projects is needed to value them more accurately.
THANKYOU CONTACTS: ANIL MARKANDYA: ANIL.MARKANDYA@BC3RESEARCH.ORG STUDY COORDINATOR: : OLIVIER.BEUCHER@BAASTEL.COM
